| Param | Original file | Final file |
|---|---|---|
| Filename | modeM0/AS1G07_051T02_9000001526cztM0_level2.evt | modeM0/AS1G07_051T02_9000001526cztM0_level2_quad_clean.evt |
| Size (bytes) | 1,955,007,360 | 263,390,400 |
| Size | 1.8 GB | 251.2 MB |
| Events in quadrant A | 12,544,019 | 1,628,833 |
| Events in quadrant B | 16,130,653 | 1,625,192 |
| Events in quadrant C | 12,304,187 | 1,622,335 |
| Events in quadrant D | 16,746,868 | 1,585,016 |
| Mode SS | |||
|---|---|---|---|
| Quadrant | BADHDUFLAG | Total packets | Discarded packets |
| A | 0 | 422 | 0 |
| B | 0 | 422 | 0 |
| C | 0 | 422 | 0 |
| D | 0 | 422 | 0 |
| Mode M9 | |||
|---|---|---|---|
| Quadrant | BADHDUFLAG | Total packets | Discarded packets |
| A | 0 | 24 | 0 |
| B | 0 | 24 | 0 |
| C | 0 | 24 | 0 |
| D | 0 | 24 | 0 |
| Mode M0 | |||
|---|---|---|---|
| Quadrant | BADHDUFLAG | Total packets | Discarded packets |
| A | 0 | 52840 | 0 |
| B | 0 | 63045 | 0 |
| C | 0 | 52772 | 0 |
| D | 0 | 64574 | 0 |
| Quadrant | Total seconds | Saturated seconds | Saturation percentage |
|---|---|---|---|
| A | 22022 | 1421 | 6.452638% |
| B | 21998 | 1953 | 8.878080% |
| C | 22096 | 1299 | 5.878892% |
| D | 22157 | 1570 | 7.085797% |
Noise dominated data is calculated using 1-second bins in cleaned event files. If a bin has >2000 counts, and if more than 50% of those come from <1% of pixels, then it is considered to be noise-dominated and hence unusable.
| Quadrant | # 1 sec bins | Bins with >0 counts | Bins with >2000 counts | High rate bins dominated by noise | Noise dominated (total time) | Noise dominated (detector-on time) | Marked lightcurve |
|---|---|---|---|---|---|---|---|
| A | 42506 | 22283 | 1118 | 1118 | 2.63% | 5.02% |  |
| B | 42506 | 22245 | 1402 | 1402 | 3.30% | 6.30% | 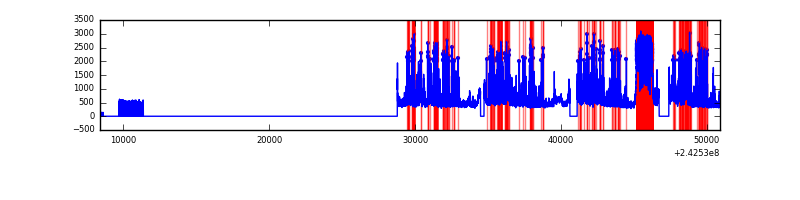 |
| C | 42506 | 22326 | 1056 | 1056 | 2.48% | 4.73% |  |
| D | 42506 | 22255 | 1329 | 1329 | 3.13% | 5.97% |  |
Top three noisy pixels from each quadrant. If the there are fewer than three noisy pixels in the level2.evt file, extra rows are filled as -1
| Pixel properties | Quadrant properties | ||||||
|---|---|---|---|---|---|---|---|
| Quadrant | DetID | PixID | Counts | Sigma | Mean | Median | Sigma |
| A | 3 | 80 | 159720 | 221.67 | 3182 | 3151 | 706.3 |
| A | 13 | 251 | 50773 | 67.42 | 3182 | 3151 | 706.3 |
| A | 0 | 226 | 27797 | 34.89 | 3182 | 3151 | 706.3 |
| B | 4 | 239 | 3141607 | 4363.85 | 3180 | 3116 | 719.2 |
| B | 0 | 214 | 360849 | 497.4 | 3180 | 3116 | 719.2 |
| B | 11 | 51 | 236309 | 324.24 | 3180 | 3116 | 719.2 |
| C | 15 | 48 | 58554 | 65.09 | 3127 | 3155 | 851.1 |
| C | 14 | 234 | 56397 | 62.56 | 3127 | 3155 | 851.1 |
| C | 13 | 61 | 21631 | 21.71 | 3127 | 3155 | 851.1 |
| D | 2 | 16 | 1893541 | 2185.58 | 3155 | 3107 | 865.0 |
| D | 8 | 195 | 1585335 | 1829.25 | 3155 | 3107 | 865.0 |
| D | 1 | 52 | 558322 | 641.9 | 3155 | 3107 | 865.0 |
Histogram calculated using DETX and DETY for each event in the final _common_clean file
| Quadrant A |  |
 |
Quadrant B |
|---|---|---|---|
| Quadrant D |  |
 |
Quadrant C |
| Plot type | Count rate plots | Images |
|---|---|---|
| Comparison with Poisson distribution Blue bars denote a histogram of data divided into 1 sec bins. Red curve is a Poisson curve with rate = median count rate of data. |
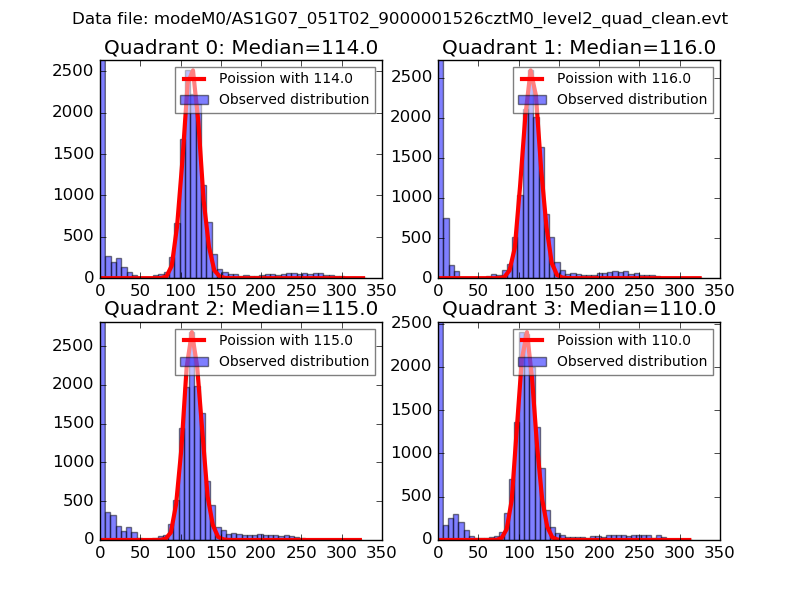 |
 |
| Quadrant-wise count rates Data is divided into 100 sec bins |
 |
|
| Module-wise count rates for Quadrant A Data is divided into 100 sec bins |
 |
 |
| Module-wise count rates for Quadrant B Data is divided into 100 sec bins |
 |
 |
| Module-wise count rates for Quadrant C Data is divided into 100 sec bins |
 |
 |
| Module-wise count rates for Quadrant D Data is divided into 100 sec bins |
 |
 |
| Parameter | Plot |
|---|---|
| CZT HV Monitor |  |
| D_VDD | 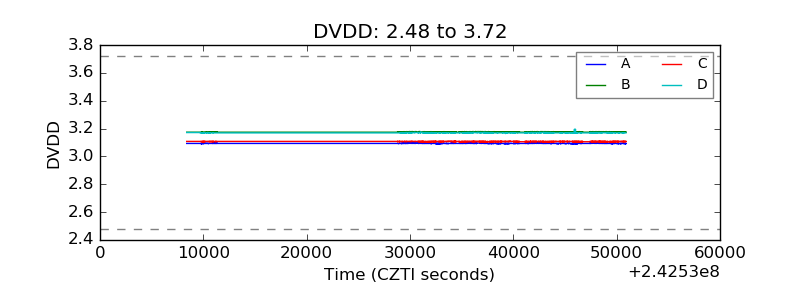 |
| Temperature 1 |  |
| Veto HV Monitor |  |
| Veto LLD |  |
| Alpha Counter |  |
| _CPM_Rate |  |
| CZT Counter |  |
| +2.5 Volts monitor |  |
| +5 Volts monitor |  |
| _ROLL_ROT |  |
| _Roll_DEC |  |
| _Roll_RA | 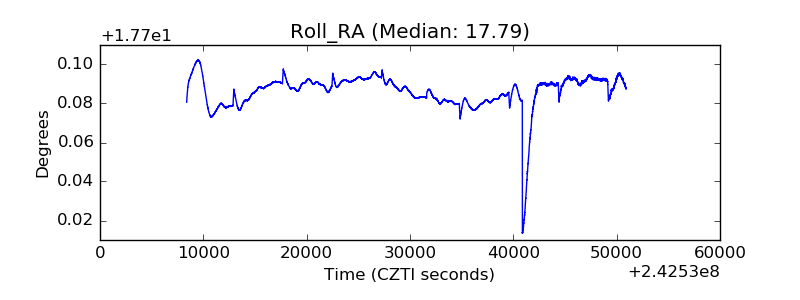 |
| Veto Counter |  |