| Param | Original file | Final file |
|---|---|---|
| Filename | modeM0/AS1A03_084T01_9000001514cztM0_level2.evt | modeM0/AS1A03_084T01_9000001514cztM0_level2_quad_clean.evt |
| Size (bytes) | 1,636,830,720 | 251,354,880 |
| Size | 1.5 GB | 239.7 MB |
| Events in quadrant A | 16,312,561 | 1,493,726 |
| Events in quadrant B | 11,225,037 | 1,604,425 |
| Events in quadrant C | 9,197,506 | 1,588,628 |
| Events in quadrant D | 11,493,285 | 1,557,048 |
| Mode M9 | |||
|---|---|---|---|
| Quadrant | BADHDUFLAG | Total packets | Discarded packets |
| A | 0 | 41 | 0 |
| B | 0 | 41 | 0 |
| C | 0 | 41 | 0 |
| D | 0 | 41 | 0 |
| Mode SS | |||
|---|---|---|---|
| Quadrant | BADHDUFLAG | Total packets | Discarded packets |
| A | 0 | 415 | 0 |
| B | 0 | 409 | 0 |
| C | 0 | 415 | 0 |
| D | 0 | 417 | 0 |
| Mode M0 | |||
|---|---|---|---|
| Quadrant | BADHDUFLAG | Total packets | Discarded packets |
| A | 0 | 60850 | 0 |
| B | 0 | 45408 | 0 |
| C | 0 | 40709 | 0 |
| D | 0 | 47155 | 0 |
| Quadrant | Total seconds | Saturated seconds | Saturation percentage |
|---|---|---|---|
| A | 19711 | 3478 | 17.644970% |
| B | 19467 | 650 | 3.338984% |
| C | 19709 | 280 | 1.420671% |
| D | 20581 | 349 | 1.695739% |
Noise dominated data is calculated using 1-second bins in cleaned event files. If a bin has >2000 counts, and if more than 50% of those come from <1% of pixels, then it is considered to be noise-dominated and hence unusable.
| Quadrant | # 1 sec bins | Bins with >0 counts | Bins with >2000 counts | High rate bins dominated by noise | Noise dominated (total time) | Noise dominated (detector-on time) | Marked lightcurve |
|---|---|---|---|---|---|---|---|
| A | 24982 | 20066 | 3094 | 3094 | 12.38% | 15.42% |  |
| B | 24982 | 19863 | 262 | 262 | 1.05% | 1.32% |  |
| C | 24982 | 20057 | 3 | 3 | 0.01% | 0.01% | 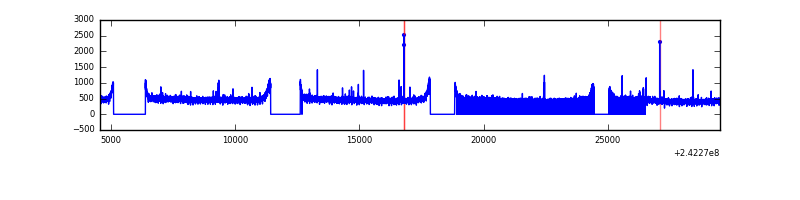 |
| D | 24982 | 20715 | 38 | 38 | 0.15% | 0.18% |  |
Top three noisy pixels from each quadrant. If the there are fewer than three noisy pixels in the level2.evt file, extra rows are filled as -1
| Pixel properties | Quadrant properties | ||||||
|---|---|---|---|---|---|---|---|
| Quadrant | DetID | PixID | Counts | Sigma | Mean | Median | Sigma |
| A | 15 | 239 | 7672398 | 17546.69 | 2150 | 2102 | 437.1 |
| A | 3 | 80 | 202834 | 459.2 | 2150 | 2102 | 437.1 |
| A | 13 | 251 | 70851 | 157.27 | 2150 | 2102 | 437.1 |
| B | 4 | 239 | 1323927 | 2935.84 | 2390 | 2342 | 450.2 |
| B | 11 | 51 | 324093 | 714.75 | 2390 | 2342 | 450.2 |
| B | 0 | 214 | 104883 | 227.79 | 2390 | 2342 | 450.2 |
| C | 14 | 234 | 45547 | 79.4 | 2345 | 2357 | 544.0 |
| C | 13 | 61 | 17447 | 27.74 | 2345 | 2357 | 544.0 |
| C | 3 | 254 | 8674 | 11.61 | 2345 | 2357 | 544.0 |
| D | 8 | 195 | 1175820 | 2029.06 | 2425 | 2361 | 578.3 |
| D | 1 | 20 | 493557 | 849.34 | 2425 | 2361 | 578.3 |
| D | 1 | 52 | 344535 | 591.66 | 2425 | 2361 | 578.3 |
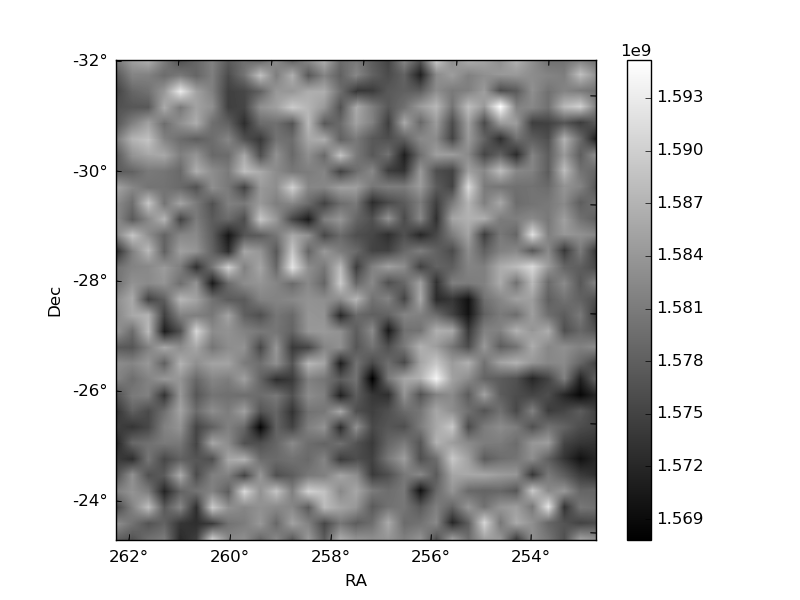
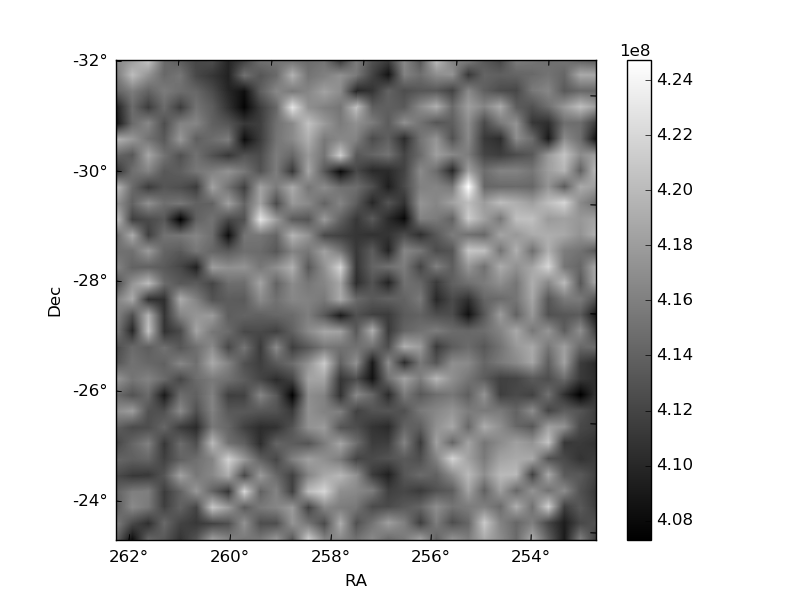
Histogram calculated using DETX and DETY for each event in the final _common_clean file
| Quadrant A |  |
 |
Quadrant B |
|---|---|---|---|
| Quadrant D |  |
 |
Quadrant C |
| Plot type | Count rate plots | Images |
|---|---|---|
| Comparison with Poisson distribution Blue bars denote a histogram of data divided into 1 sec bins. Red curve is a Poisson curve with rate = median count rate of data. |
 |
 |
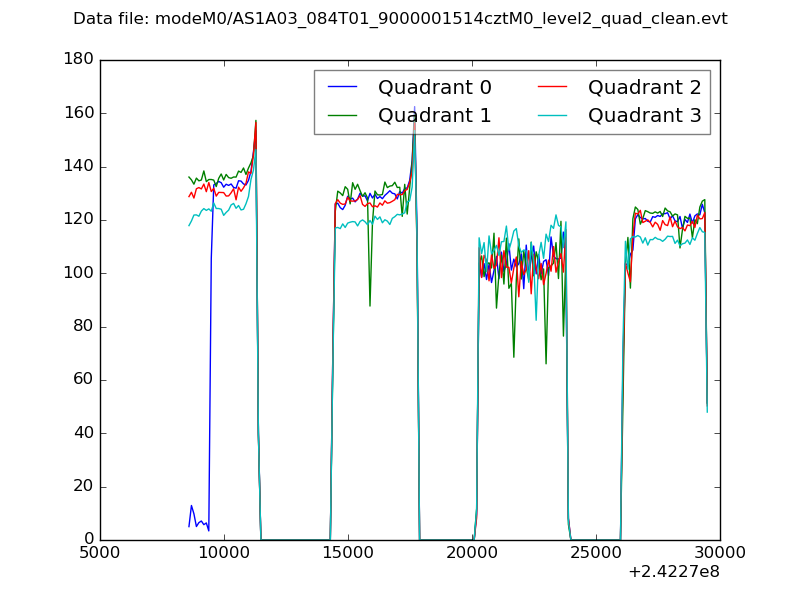
| Quadrant-wise count rates Data is divided into 100 sec bins |
 |
|
| Module-wise count rates for Quadrant A Data is divided into 100 sec bins |
 |
 |
| Module-wise count rates for Quadrant B Data is divided into 100 sec bins |
 |
 |
| Module-wise count rates for Quadrant C Data is divided into 100 sec bins |
 |
 |
| Module-wise count rates for Quadrant D Data is divided into 100 sec bins |
 |
 |
| Parameter | Plot |
|---|---|
| CZT HV Monitor |  |
| D_VDD | 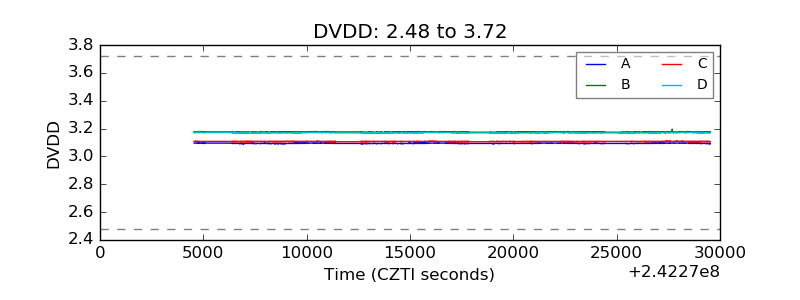 |
| Temperature 1 |  |
| Veto HV Monitor |  |
| Veto LLD |  |
| Alpha Counter |  |
| _CPM_Rate |  |
| CZT Counter |  |
| +2.5 Volts monitor |  |
| +5 Volts monitor |  |
| _ROLL_ROT | 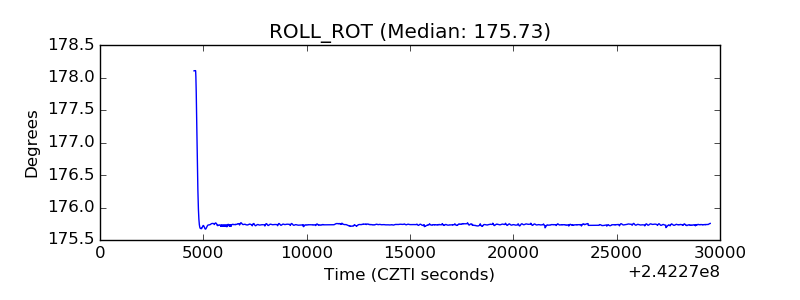 |
| _Roll_DEC |  |
| _Roll_RA |  |
| Veto Counter |  |