| Param | Original file | Final file |
|---|---|---|
| Filename | modeM0/AS1G07_068T02_9000001508cztM0_level2_bc.evt | modeM0/AS1G07_068T02_9000001508cztM0_level2_quad_clean.evt |
| Size (bytes) | 1,189,347,840 | 308,571,840 |
| Size | 1.1 GB | 294.3 MB |
| Events in quadrant A | 10,210,574 | 1,836,058 |
| Events in quadrant B | 7,998,271 | 1,919,212 |
| Events in quadrant C | 5,388,416 | 1,967,139 |
| Events in quadrant D | 10,678,025 | 1,864,986 |
| Mode SS | |||
|---|---|---|---|
| Quadrant | BADHDUFLAG | Total packets | Discarded packets |
| A | 0 | 532 | 0 |
| B | 0 | 530 | 0 |
| C | 0 | 531 | 0 |
| D | 0 | 527 | 0 |
| Mode M9 | |||
|---|---|---|---|
| Quadrant | BADHDUFLAG | Total packets | Discarded packets |
| A | 0 | 61 | 0 |
| B | 0 | 61 | 0 |
| C | 0 | 61 | 0 |
| D | 0 | 61 | 0 |
| Mode M0 | |||
|---|---|---|---|
| Quadrant | BADHDUFLAG | Total packets | Discarded packets |
| A | 0 | 68493 | 0 |
| B | 0 | 63376 | 0 |
| C | 0 | 53314 | 0 |
| D | 0 | 71352 | 0 |
| Quadrant | Total seconds | Saturated seconds | Saturation percentage |
|---|---|---|---|
| A | 25072 | 572 | 2.281429% |
| B | 25255 | 916 | 3.627005% |
| C | 25796 | 199 | 0.771437% |
| D | 26087 | 1066 | 4.086327% |
Noise dominated data is calculated using 1-second bins in cleaned event files. If a bin has >2000 counts, and if more than 50% of those come from <1% of pixels, then it is considered to be noise-dominated and hence unusable.
| Quadrant | # 1 sec bins | Bins with >0 counts | Bins with >2000 counts | High rate bins dominated by noise | Noise dominated (total time) | Noise dominated (detector-on time) | Marked lightcurve |
|---|---|---|---|---|---|---|---|
| A | 32526 | 25863 | 22 | 22 | 0.07% | 0.09% |  |
| B | 32526 | 25950 | 29 | 29 | 0.09% | 0.11% |  |
| C | 32526 | 26391 | 2 | 2 | 0.01% | 0.01% |  |
| D | 32526 | 26356 | 94 | 94 | 0.29% | 0.36% |  |
Top three noisy pixels from each quadrant. If the there are fewer than three noisy pixels in the level2.evt file, extra rows are filled as -1
| Pixel properties | Quadrant properties | ||||||
|---|---|---|---|---|---|---|---|
| Quadrant | DetID | PixID | Counts | Sigma | Mean | Median | Sigma |
| A | 13 | 251 | 5140416 | 18479.01 | 1291 | 1265 | 278.1 |
| A | 4 | 2 | 38940 | 135.47 | 1291 | 1265 | 278.1 |
| A | 14 | 254 | 22552 | 76.54 | 1291 | 1265 | 278.1 |
| B | 4 | 239 | 2025058 | 8248.79 | 1317 | 1285 | 245.3 |
| B | 10 | 245 | 309832 | 1257.62 | 1317 | 1285 | 245.3 |
| B | 4 | 81 | 268958 | 1091.02 | 1317 | 1285 | 245.3 |
| C | 14 | 234 | 87772 | 291.2 | 1351 | 1332 | 296.8 |
| C | 14 | 67 | 11158 | 33.1 | 1351 | 1332 | 296.8 |
| C | 13 | 61 | 8036 | 22.58 | 1351 | 1332 | 296.8 |
| D | 2 | 33 | 1877552 | 6152.42 | 1340 | 1293 | 305.0 |
| D | 8 | 195 | 1755835 | 5753.3 | 1340 | 1293 | 305.0 |
| D | 1 | 52 | 707768 | 2316.6 | 1340 | 1293 | 305.0 |
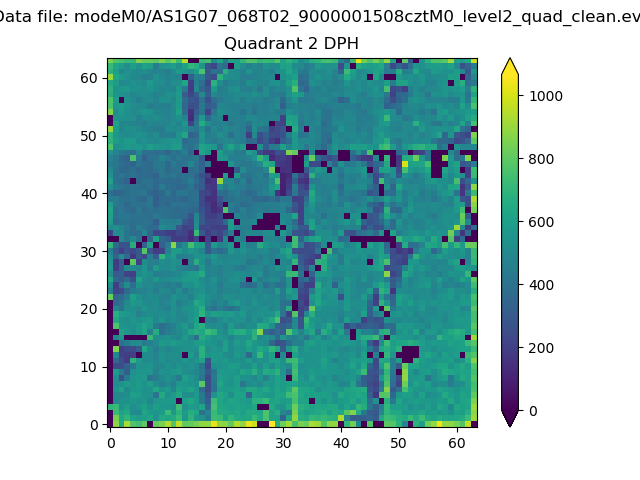
Histogram calculated using DETX and DETY for each event in the final _common_clean file
| Quadrant A |  |
 |
Quadrant B |
|---|---|---|---|
| Quadrant D |  |
 |
Quadrant C |
| Plot type | Count rate plots | Images |
|---|---|---|
| Comparison with Poisson distribution Blue bars denote a histogram of data divided into 1 sec bins. Red curve is a Poisson curve with rate = median count rate of data. |
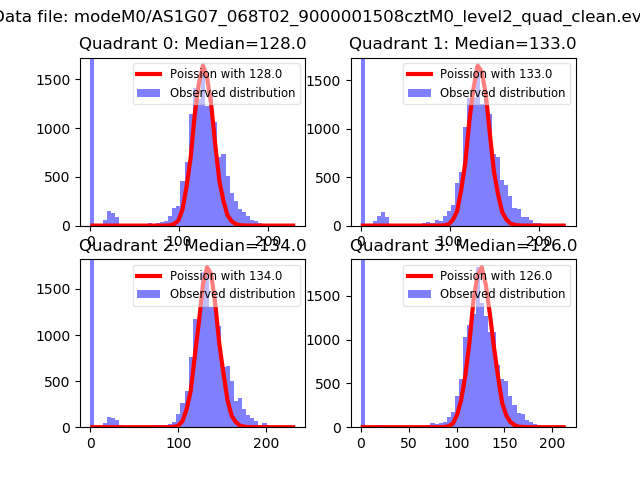 |
 |
| Quadrant-wise count rates Data is divided into 100 sec bins |
 |
|
| Module-wise count rates for Quadrant A Data is divided into 100 sec bins |
 |
 |
| Module-wise count rates for Quadrant B Data is divided into 100 sec bins |
 |
 |
| Module-wise count rates for Quadrant C Data is divided into 100 sec bins |
 |
 |
| Module-wise count rates for Quadrant D Data is divided into 100 sec bins |
 |
 |
| Parameter | Plot |
|---|---|
| CZT HV Monitor |  |
| D_VDD |  |
| Temperature 1 |  |
| Veto HV Monitor | 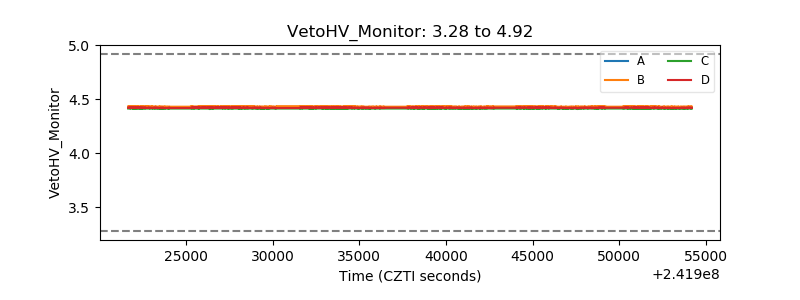 |
| Veto LLD |  |
| Alpha Counter |  |
| _CPM_Rate | 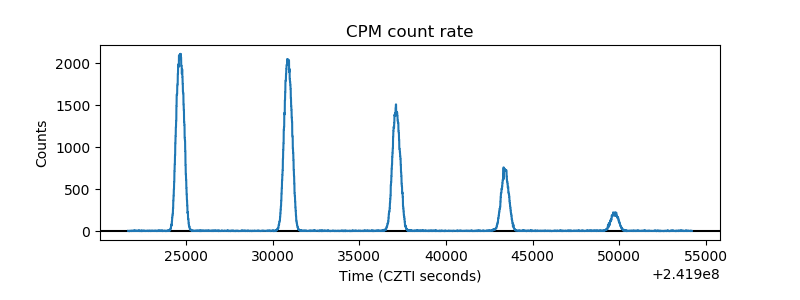 |
| CZT Counter |  |
| +2.5 Volts monitor |  |
| +5 Volts monitor |  |
| _ROLL_ROT |  |
| _Roll_DEC | 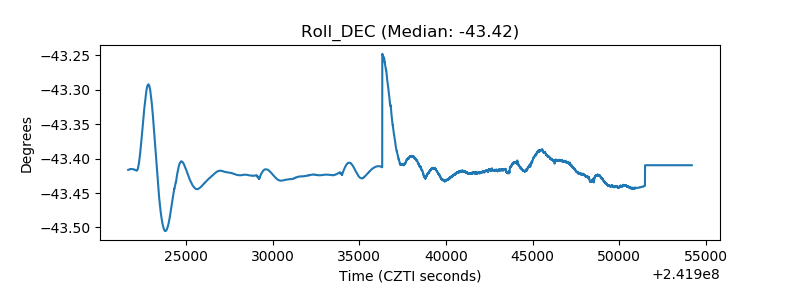 |
| _Roll_RA | 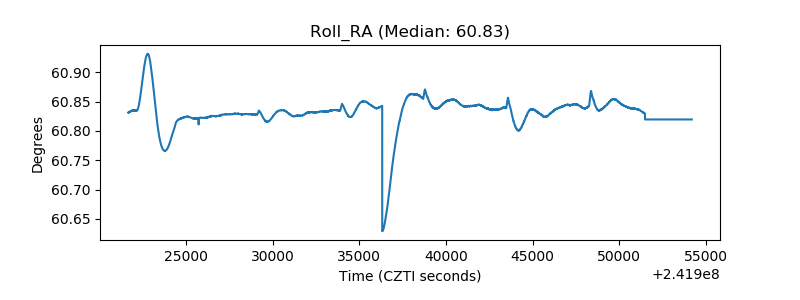 |
| Veto Counter |  |