| Param | Original file | Final file |
|---|---|---|
| Filename | modeM0/AS1A03_126T01_9000001512cztM0_level2.evt | modeM0/AS1A03_126T01_9000001512cztM0_level2_quad_clean.evt |
| Size (bytes) | 11,481,373,440 | 1,917,849,600 |
| Size | 10.7 GB | 1.8 GB |
| Events in quadrant A | 137,453,136 | 13,813,628 |
| Events in quadrant B | 103,706,355 | 15,527,589 |
| Events in quadrant C | 86,046,287 | 17,568,580 |
| Events in quadrant D | 10,869,347 | 1,368,123 |
| Mode M0 | |||
|---|---|---|---|
| Quadrant | BADHDUFLAG | Total packets | Discarded packets |
| A | 0 | 522470 | 0 |
| B | 0 | 428506 | 0 |
| C | 0 | 384032 | 0 |
| D | 0 | 44030 | 0 |
| Mode M9 | |||
|---|---|---|---|
| Quadrant | BADHDUFLAG | Total packets | Discarded packets |
| A | 0 | 326 | 0 |
| B | 0 | 327 | 0 |
| C | 0 | 327 | 0 |
| D | 0 | 327 | 0 |
| Mode SS | |||
|---|---|---|---|
| Quadrant | BADHDUFLAG | Total packets | Discarded packets |
| A | 0 | 3566 | 0 |
| B | 0 | 3728 | 0 |
| C | 0 | 3414 | 0 |
| D | 0 | 3705 | 0 |
| Quadrant | Total seconds | Saturated seconds | Saturation percentage |
|---|---|---|---|
| A | 174546 | 15127 | 8.666483% |
| B | 184108 | 5337 | 2.898842% |
| C | 187651 | 1220 | 0.650143% |
| D | 17736 | 147 | 0.828823% |
Noise dominated data is calculated using 1-second bins in cleaned event files. If a bin has >2000 counts, and if more than 50% of those come from <1% of pixels, then it is considered to be noise-dominated and hence unusable.
| Quadrant | # 1 sec bins | Bins with >0 counts | Bins with >2000 counts | High rate bins dominated by noise | Noise dominated (total time) | Noise dominated (detector-on time) | Marked lightcurve |
|---|---|---|---|---|---|---|---|
| A | 271295 | 186258 | 12339 | 12339 | 4.55% | 6.62% |  |
| B | 271295 | 195047 | 2292 | 2292 | 0.84% | 1.18% |  |
| C | 271295 | 197940 | 58 | 58 | 0.02% | 0.03% |  |
| D | 33462 | 18236 | 104 | 104 | 0.31% | 0.57% |  |
Top three noisy pixels from each quadrant. If the there are fewer than three noisy pixels in the level2.evt file, extra rows are filled as -1
| Pixel properties | Quadrant properties | ||||||
|---|---|---|---|---|---|---|---|
| Quadrant | DetID | PixID | Counts | Sigma | Mean | Median | Sigma |
| A | 13 | 251 | 54156895 | 13473.11 | 20020 | 19585 | 4018.2 |
| A | 3 | 80 | 2752366 | 680.1 | 20020 | 19585 | 4018.2 |
| A | 15 | 174 | 852703 | 207.34 | 20020 | 19585 | 4018.2 |
| B | 4 | 239 | 14610365 | 3578.93 | 21757 | 21224 | 4076.4 |
| B | 0 | 214 | 1403930 | 339.2 | 21757 | 21224 | 4076.4 |
| B | 11 | 51 | 1061786 | 255.26 | 21757 | 21224 | 4076.4 |
| C | 14 | 234 | 600275 | 114.64 | 21894 | 22026 | 5043.9 |
| C | 13 | 61 | 162109 | 27.77 | 21894 | 22026 | 5043.9 |
| C | 14 | 67 | 103293 | 16.11 | 21894 | 22026 | 5043.9 |
| D | 8 | 195 | 1213846 | 2466.09 | 2071 | 2017 | 491.4 |
| D | 1 | 20 | 864967 | 1756.12 | 2071 | 2017 | 491.4 |
| D | 13 | 104 | 292257 | 590.64 | 2071 | 2017 | 491.4 |
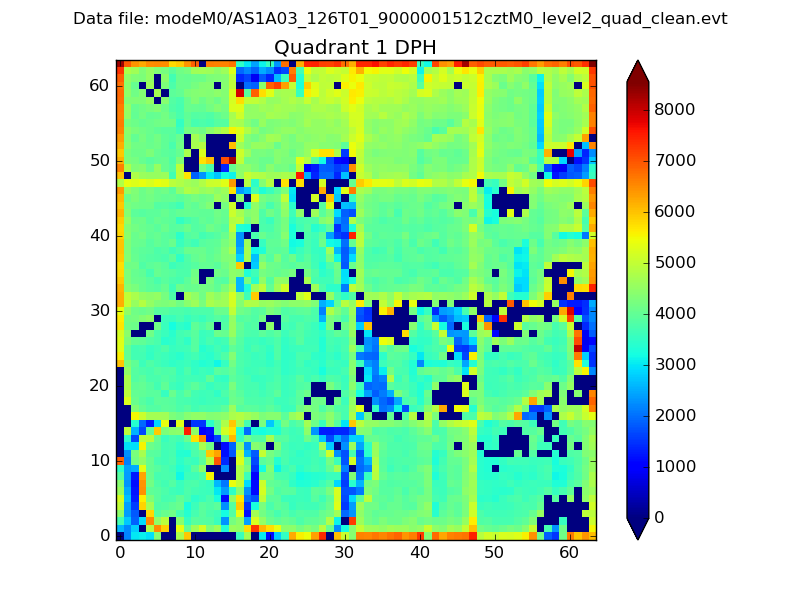
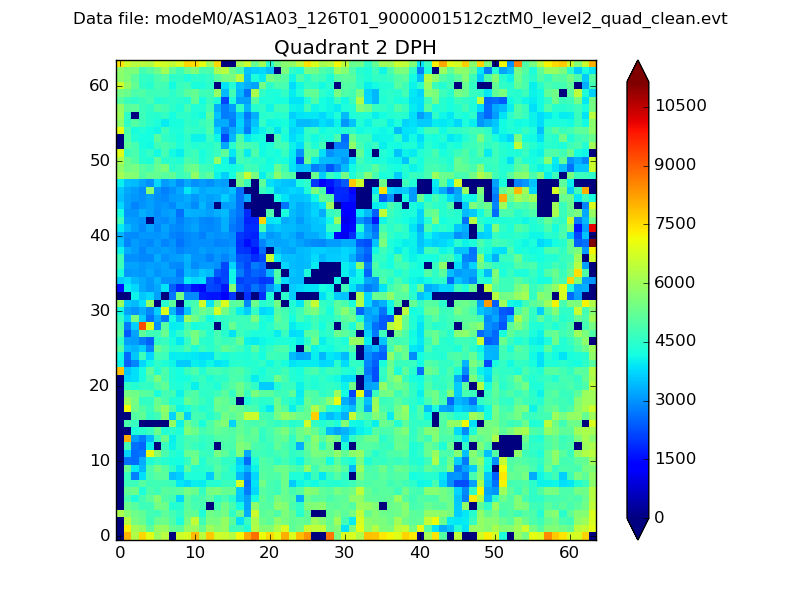
Histogram calculated using DETX and DETY for each event in the final _common_clean file
| Quadrant A |  |
 |
Quadrant B |
|---|---|---|---|
| Quadrant D |  |
 |
Quadrant C |
| Plot type | Count rate plots | Images |
|---|---|---|
| Comparison with Poisson distribution Blue bars denote a histogram of data divided into 1 sec bins. Red curve is a Poisson curve with rate = median count rate of data. |
 |
 |
| Quadrant-wise count rates Data is divided into 100 sec bins |
 |
|
| Module-wise count rates for Quadrant A Data is divided into 100 sec bins |
 |
 |
| Module-wise count rates for Quadrant B Data is divided into 100 sec bins |
 |
 |
| Module-wise count rates for Quadrant C Data is divided into 100 sec bins |
 |
 |
| Module-wise count rates for Quadrant D Data is divided into 100 sec bins |
 |
 |
| Parameter | Plot |
|---|---|
| CZT HV Monitor |  |
| D_VDD |  |
| Temperature 1 | 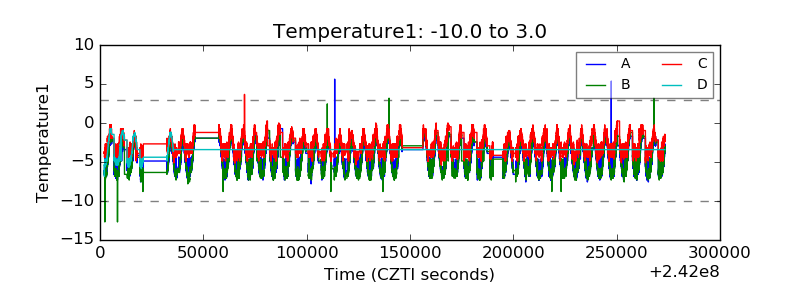 |
| Veto HV Monitor |  |
| Veto LLD |  |
| Alpha Counter |  |
| _CPM_Rate |  |
| CZT Counter |  |
| +2.5 Volts monitor |  |
| +5 Volts monitor | 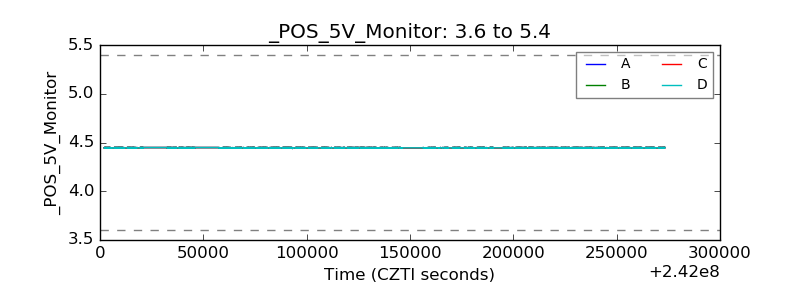 |
| _ROLL_ROT |  |
| _Roll_DEC |  |
| _Roll_RA |  |
| Veto Counter | 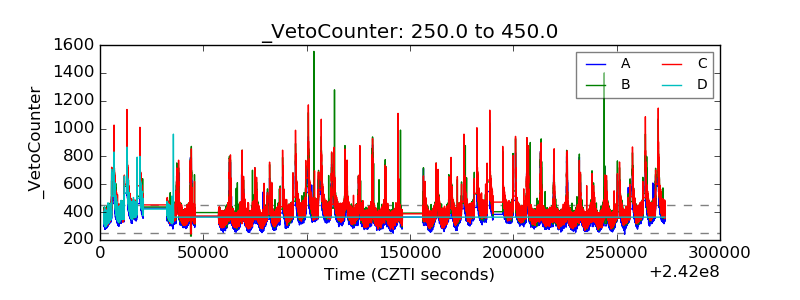 |