| Param | Original file | Final file |
|---|---|---|
| Filename | modeM0/AS1G07_046T01_9000001506cztM0_level2_bc.evt | modeM0/AS1G07_046T01_9000001506cztM0_level2_quad_clean.evt |
| Size (bytes) | 1,577,856,960 | 476,786,880 |
| Size | 1.5 GB | 454.7 MB |
| Events in quadrant A | 9,222,957 | 2,929,891 |
| Events in quadrant B | 11,950,328 | 3,214,279 |
| Events in quadrant C | 7,830,659 | 2,959,814 |
| Events in quadrant D | 16,223,738 | 2,761,995 |
| Mode SS | |||
|---|---|---|---|
| Quadrant | BADHDUFLAG | Total packets | Discarded packets |
| A | 0 | 831 | 0 |
| B | 0 | 834 | 0 |
| C | 0 | 718 | 0 |
| D | 0 | 718 | 0 |
| Mode M0 | |||
|---|---|---|---|
| Quadrant | BADHDUFLAG | Total packets | Discarded packets |
| A | 0 | 86973 | 0 |
| B | 0 | 98008 | 0 |
| C | 0 | 83299 | 0 |
| D | 0 | 107993 | 0 |
| Mode M9 | |||
|---|---|---|---|
| Quadrant | BADHDUFLAG | Total packets | Discarded packets |
| A | 0 | 44 | 0 |
| B | 0 | 44 | 0 |
| C | 0 | 44 | 0 |
| D | 0 | 44 | 0 |
| Quadrant | Total seconds | Saturated seconds | Saturation percentage |
|---|---|---|---|
| A | 40007 | 875 | 2.187117% |
| B | 39552 | 1957 | 4.947917% |
| C | 40225 | 563 | 1.399627% |
| D | 40533 | 1434 | 3.537858% |
Noise dominated data is calculated using 1-second bins in cleaned event files. If a bin has >2000 counts, and if more than 50% of those come from <1% of pixels, then it is considered to be noise-dominated and hence unusable.
| Quadrant | # 1 sec bins | Bins with >0 counts | Bins with >2000 counts | High rate bins dominated by noise | Noise dominated (total time) | Noise dominated (detector-on time) | Marked lightcurve |
|---|---|---|---|---|---|---|---|
| A | 46316 | 41386 | 3 | 3 | 0.01% | 0.01% |  |
| B | 46316 | 40965 | 115 | 115 | 0.25% | 0.28% |  |
| C | 46315 | 41523 | 2 | 2 | 0.00% | 0.00% |  |
| D | 46316 | 41467 | 181 | 181 | 0.39% | 0.44% |  |
Top three noisy pixels from each quadrant. If the there are fewer than three noisy pixels in the level2.evt file, extra rows are filled as -1
| Pixel properties | Quadrant properties | ||||||
|---|---|---|---|---|---|---|---|
| Quadrant | DetID | PixID | Counts | Sigma | Mean | Median | Sigma |
| A | 13 | 251 | 1525753 | 3514.45 | 1961 | 1917 | 433.6 |
| A | 1 | 162 | 51420 | 114.17 | 1961 | 1917 | 433.6 |
| A | 13 | 253 | 35940 | 78.47 | 1961 | 1917 | 433.6 |
| B | 4 | 239 | 2902260 | 8089.61 | 2042 | 1982 | 358.5 |
| B | 10 | 245 | 794983 | 2211.88 | 2042 | 1982 | 358.5 |
| B | 11 | 51 | 130151 | 357.5 | 2042 | 1982 | 358.5 |
| C | 14 | 234 | 143921 | 328.45 | 1953 | 1924 | 432.3 |
| C | 8 | 128 | 12618 | 24.74 | 1953 | 1924 | 432.3 |
| C | 13 | 61 | 12060 | 23.45 | 1953 | 1924 | 432.3 |
| D | 8 | 195 | 3431200 | 7578.71 | 1945 | 1870 | 452.5 |
| D | 1 | 20 | 1869969 | 4128.44 | 1945 | 1870 | 452.5 |
| D | 1 | 52 | 1494654 | 3299.01 | 1945 | 1870 | 452.5 |
Histogram calculated using DETX and DETY for each event in the final _common_clean file
| Quadrant A | 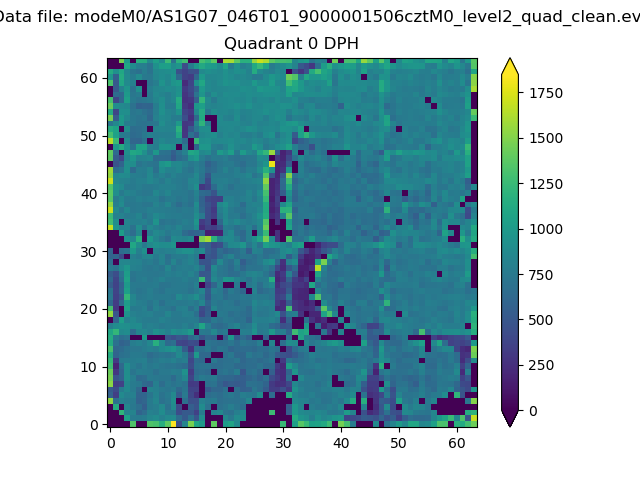 |
 |
Quadrant B |
|---|---|---|---|
| Quadrant D |  |
 |
Quadrant C |
| Plot type | Count rate plots | Images |
|---|---|---|
| Comparison with Poisson distribution Blue bars denote a histogram of data divided into 1 sec bins. Red curve is a Poisson curve with rate = median count rate of data. |
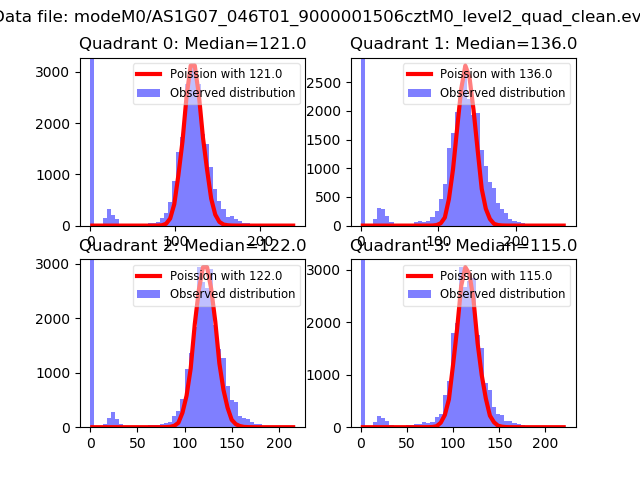 |
 |
| Quadrant-wise count rates Data is divided into 100 sec bins |
 |
|
| Module-wise count rates for Quadrant A Data is divided into 100 sec bins |
 |
 |
| Module-wise count rates for Quadrant B Data is divided into 100 sec bins |
 |
 |
| Module-wise count rates for Quadrant C Data is divided into 100 sec bins |
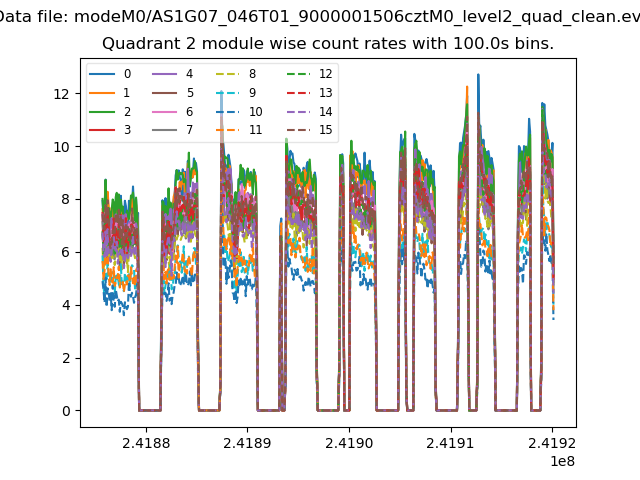 |
 |
| Module-wise count rates for Quadrant D Data is divided into 100 sec bins |
 |
 |
| Parameter | Plot |
|---|---|
| CZT HV Monitor |  |
| D_VDD |  |
| Temperature 1 |  |
| Veto HV Monitor |  |
| Veto LLD | 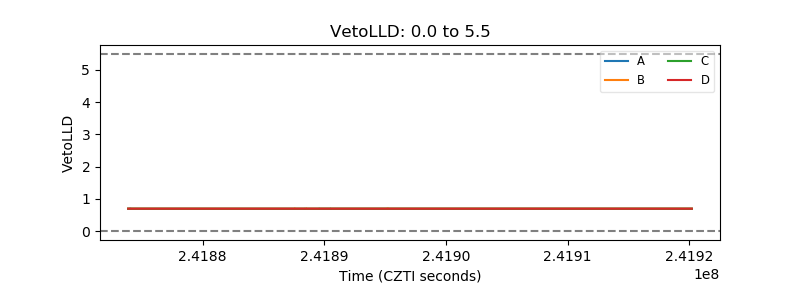 |
| Alpha Counter |  |
| _CPM_Rate |  |
| CZT Counter | 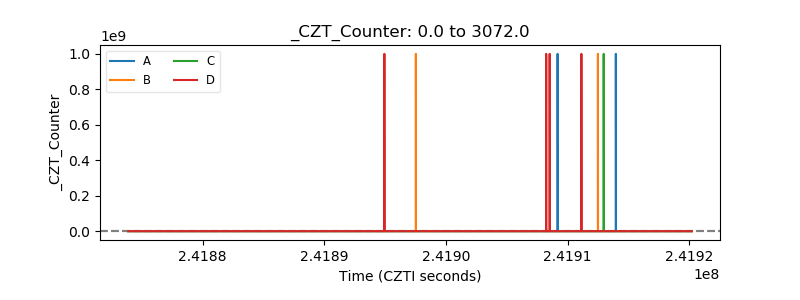 |
| +2.5 Volts monitor |  |
| +5 Volts monitor | 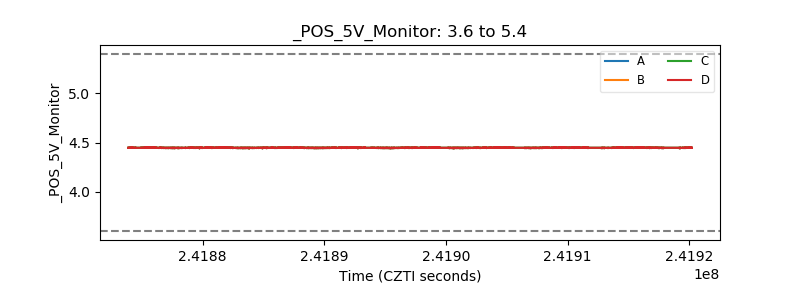 |
| _ROLL_ROT |  |
| _Roll_DEC | 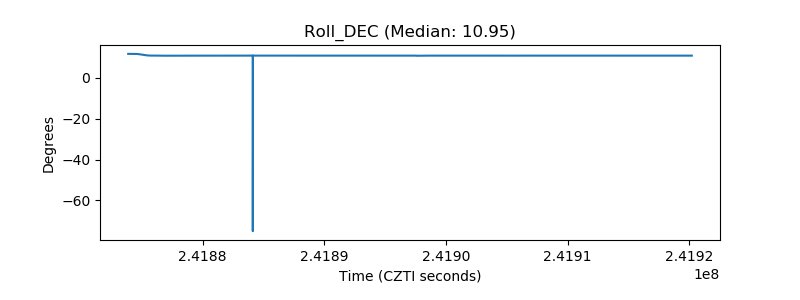 |
| _Roll_RA | 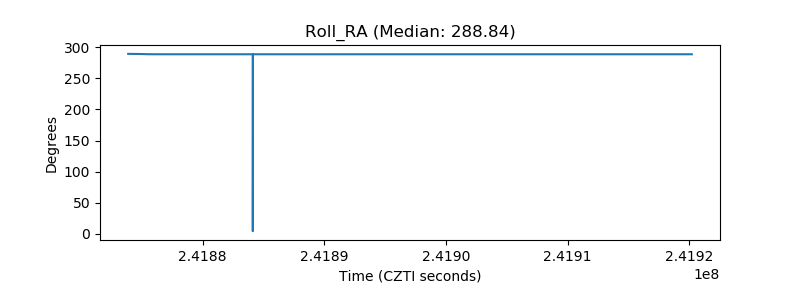 |
| Veto Counter |  |