| Param | Original file | Final file |
|---|---|---|
| Filename | modeM0/AS1G07_057T02_9000001504cztM0_level2_bc.evt | modeM0/AS1G07_057T02_9000001504cztM0_level2_quad_clean.evt |
| Size (bytes) | 1,741,273,920 | 604,540,800 |
| Size | 1.6 GB | 576.5 MB |
| Events in quadrant A | 9,919,760 | 3,686,438 |
| Events in quadrant B | 12,646,781 | 3,795,383 |
| Events in quadrant C | 9,334,669 | 3,728,413 |
| Events in quadrant D | 17,617,016 | 3,872,628 |
| Mode M0 | |||
|---|---|---|---|
| Quadrant | BADHDUFLAG | Total packets | Discarded packets |
| A | 0 | 96404 | 0 |
| B | 0 | 99363 | 0 |
| C | 0 | 95372 | 0 |
| D | 0 | 122196 | 0 |
| Mode M9 | |||
|---|---|---|---|
| Quadrant | BADHDUFLAG | Total packets | Discarded packets |
| A | 0 | 97 | 0 |
| B | 0 | 97 | 0 |
| C | 0 | 96 | 0 |
| D | 0 | 97 | 0 |
| Mode SS | |||
|---|---|---|---|
| Quadrant | BADHDUFLAG | Total packets | Discarded packets |
| A | 0 | 1018 | 0 |
| B | 0 | 1028 | 0 |
| C | 0 | 1029 | 0 |
| D | 0 | 1029 | 0 |
| Quadrant | Total seconds | Saturated seconds | Saturation percentage |
|---|---|---|---|
| A | 46506 | 335 | 0.720337% |
| B | 44576 | 636 | 1.426777% |
| C | 46857 | 206 | 0.439635% |
| D | 49893 | 544 | 1.090333% |
Noise dominated data is calculated using 1-second bins in cleaned event files. If a bin has >2000 counts, and if more than 50% of those come from <1% of pixels, then it is considered to be noise-dominated and hence unusable.
| Quadrant | # 1 sec bins | Bins with >0 counts | Bins with >2000 counts | High rate bins dominated by noise | Noise dominated (total time) | Noise dominated (detector-on time) | Marked lightcurve |
|---|---|---|---|---|---|---|---|
| A | 69738 | 54087 | 0 | 0 | 0.00% | 0.00% |  |
| B | 69737 | 52485 | 12 | 12 | 0.02% | 0.02% |  |
| C | 69738 | 54254 | 0 | 0 | 0.00% | 0.00% |  |
| D | 69738 | 53717 | 70 | 70 | 0.10% | 0.13% |  |
Top three noisy pixels from each quadrant. If the there are fewer than three noisy pixels in the level2.evt file, extra rows are filled as -1
| Pixel properties | Quadrant properties | ||||||
|---|---|---|---|---|---|---|---|
| Quadrant | DetID | PixID | Counts | Sigma | Mean | Median | Sigma |
| A | 13 | 251 | 669477 | 1305.45 | 2352 | 2302 | 511.1 |
| A | 4 | 2 | 83224 | 158.34 | 2352 | 2302 | 511.1 |
| A | 8 | 15 | 30470 | 55.12 | 2352 | 2302 | 511.1 |
| B | 4 | 239 | 1285368 | 2762.01 | 2628 | 2561 | 464.4 |
| B | 0 | 219 | 317882 | 678.92 | 2628 | 2561 | 464.4 |
| B | 11 | 51 | 286090 | 610.47 | 2628 | 2561 | 464.4 |
| C | 14 | 234 | 83023 | 155.59 | 2355 | 2320 | 518.7 |
| C | 14 | 67 | 16377 | 27.1 | 2355 | 2320 | 518.7 |
| C | 8 | 128 | 14975 | 24.4 | 2355 | 2320 | 518.7 |
| D | 8 | 195 | 2792094 | 4803.07 | 2498 | 2407 | 580.8 |
| D | 1 | 52 | 2233571 | 3841.45 | 2498 | 2407 | 580.8 |
| D | 1 | 20 | 1755363 | 3018.11 | 2498 | 2407 | 580.8 |
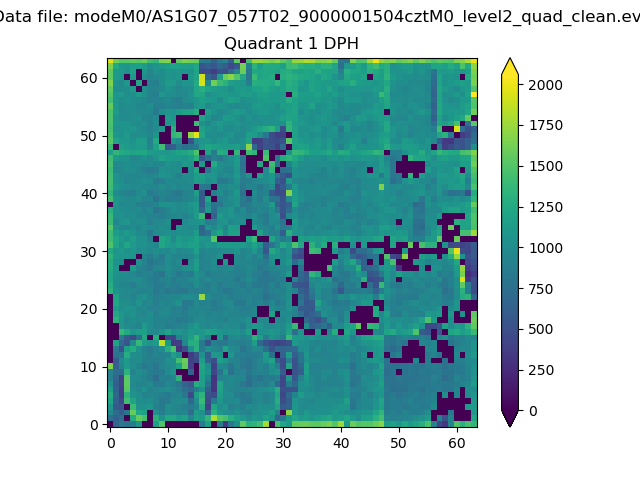
Histogram calculated using DETX and DETY for each event in the final _common_clean file
| Quadrant A |  |
 |
Quadrant B |
|---|---|---|---|
| Quadrant D | 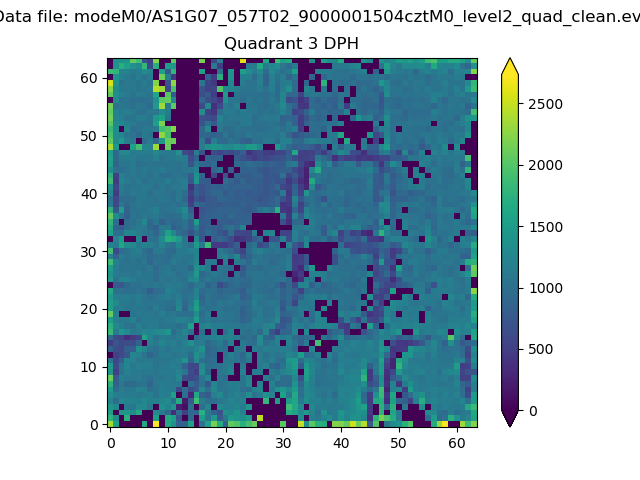 |
 |
Quadrant C |
| Plot type | Count rate plots | Images |
|---|---|---|
| Comparison with Poisson distribution Blue bars denote a histogram of data divided into 1 sec bins. Red curve is a Poisson curve with rate = median count rate of data. |
 |
 |
| Quadrant-wise count rates Data is divided into 100 sec bins |
 |
|
| Module-wise count rates for Quadrant A Data is divided into 100 sec bins |
 |
 |
| Module-wise count rates for Quadrant B Data is divided into 100 sec bins |
 |
 |
| Module-wise count rates for Quadrant C Data is divided into 100 sec bins |
 |
 |
| Module-wise count rates for Quadrant D Data is divided into 100 sec bins |
 |
 |
| Parameter | Plot |
|---|---|
| CZT HV Monitor | 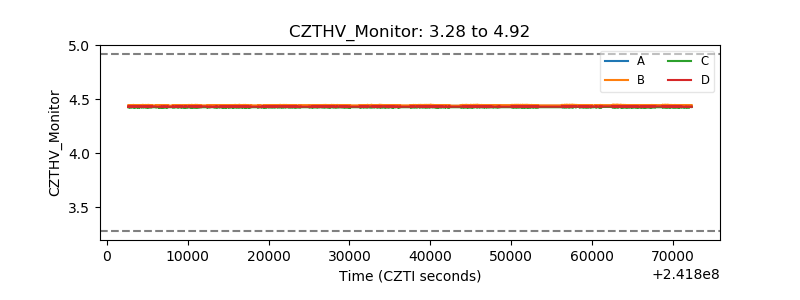 |
| D_VDD | 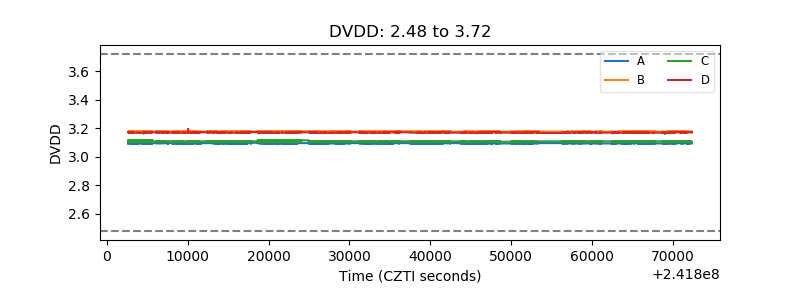 |
| Temperature 1 |  |
| Veto HV Monitor |  |
| Veto LLD |  |
| Alpha Counter |  |
| _CPM_Rate |  |
| CZT Counter |  |
| +2.5 Volts monitor |  |
| +5 Volts monitor | 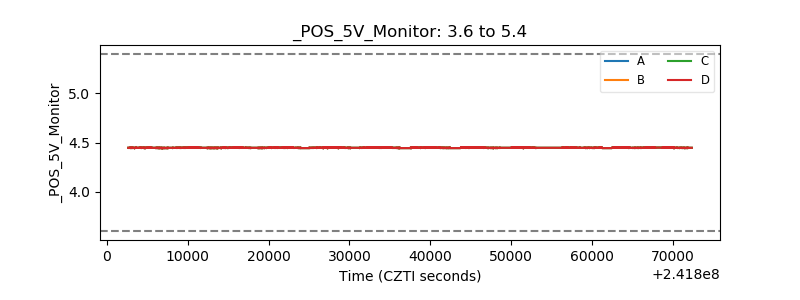 |
| _ROLL_ROT |  |
| _Roll_DEC |  |
| _Roll_RA |  |
| Veto Counter | 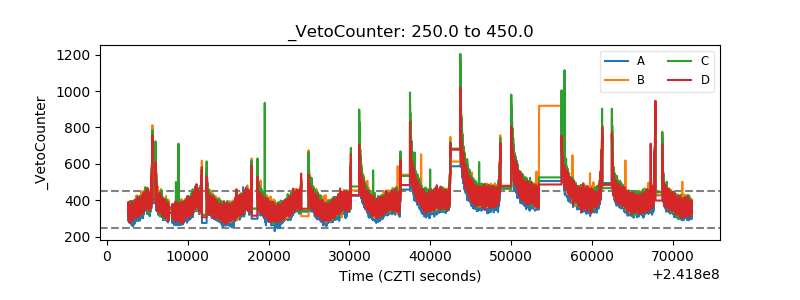 |