| Param | Original file | Final file |
|---|---|---|
| Filename | modeM0/AS1G07_028T01_9000001500cztM0_level2.evt | modeM0/AS1G07_028T01_9000001500cztM0_level2_quad_clean.evt |
| Size (bytes) | 1,647,230,400 | 272,508,480 |
| Size | 1.5 GB | 259.9 MB |
| Events in quadrant A | 11,099,363 | 1,714,999 |
| Events in quadrant B | 12,775,781 | 1,760,979 |
| Events in quadrant C | 10,796,864 | 1,691,360 |
| Events in quadrant D | 13,733,372 | 1,575,455 |
| Mode M0 | |||
|---|---|---|---|
| Quadrant | BADHDUFLAG | Total packets | Discarded packets |
| A | 0 | 45925 | 0 |
| B | 0 | 51346 | 0 |
| C | 0 | 45777 | 0 |
| D | 0 | 54749 | 0 |
| Mode M9 | |||
|---|---|---|---|
| Quadrant | BADHDUFLAG | Total packets | Discarded packets |
| A | 0 | 56 | 0 |
| B | 0 | 56 | 0 |
| C | 0 | 56 | 0 |
| D | 0 | 56 | 0 |
| Mode SS | |||
|---|---|---|---|
| Quadrant | BADHDUFLAG | Total packets | Discarded packets |
| A | 0 | 448 | 0 |
| B | 0 | 448 | 0 |
| C | 0 | 448 | 0 |
| D | 0 | 448 | 0 |
| Quadrant | Total seconds | Saturated seconds | Saturation percentage |
|---|---|---|---|
| A | 21941 | 269 | 1.226015% |
| B | 21941 | 542 | 2.470261% |
| C | 21941 | 203 | 0.925209% |
| D | 21941 | 589 | 2.684472% |
Noise dominated data is calculated using 1-second bins in cleaned event files. If a bin has >2000 counts, and if more than 50% of those come from <1% of pixels, then it is considered to be noise-dominated and hence unusable.
| Quadrant | # 1 sec bins | Bins with >0 counts | Bins with >2000 counts | High rate bins dominated by noise | Noise dominated (total time) | Noise dominated (detector-on time) | Marked lightcurve |
|---|---|---|---|---|---|---|---|
| A | 26942 | 21943 | 1 | 1 | 0.00% | 0.00% |  |
| B | 26942 | 21943 | 140 | 140 | 0.52% | 0.64% | 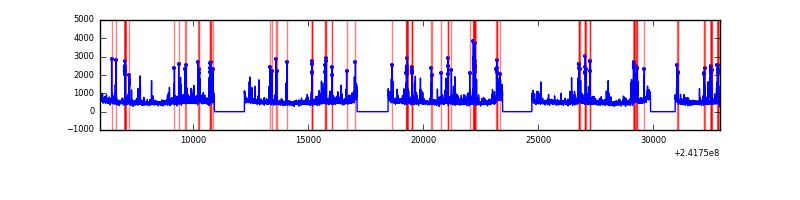 |
| C | 26942 | 21943 | 26 | 26 | 0.10% | 0.12% |  |
| D | 26942 | 21943 | 401 | 401 | 1.49% | 1.83% |  |
Top three noisy pixels from each quadrant. If the there are fewer than three noisy pixels in the level2.evt file, extra rows are filled as -1
| Pixel properties | Quadrant properties | ||||||
|---|---|---|---|---|---|---|---|
| Quadrant | DetID | PixID | Counts | Sigma | Mean | Median | Sigma |
| A | 8 | 15 | 80403 | 135.75 | 2841 | 2789 | 571.7 |
| A | 5 | 16 | 35931 | 57.97 | 2841 | 2789 | 571.7 |
| A | 0 | 226 | 25870 | 40.37 | 2841 | 2789 | 571.7 |
| B | 4 | 239 | 943697 | 1773.61 | 2843 | 2783 | 530.5 |
| B | 0 | 214 | 248193 | 462.59 | 2843 | 2783 | 530.5 |
| B | 11 | 51 | 238088 | 443.55 | 2843 | 2783 | 530.5 |
| C | 14 | 234 | 148394 | 233.16 | 2726 | 2747 | 624.7 |
| C | 13 | 61 | 20262 | 28.04 | 2726 | 2747 | 624.7 |
| C | 0 | 207 | 11523 | 14.05 | 2726 | 2747 | 624.7 |
| D | 1 | 20 | 1059365 | 1660.27 | 2685 | 2619 | 636.5 |
| D | 8 | 195 | 821039 | 1285.83 | 2685 | 2619 | 636.5 |
| D | 13 | 122 | 451823 | 705.75 | 2685 | 2619 | 636.5 |
Histogram calculated using DETX and DETY for each event in the final _common_clean file
| Quadrant A |  |
 |
Quadrant B |
|---|---|---|---|
| Quadrant D | 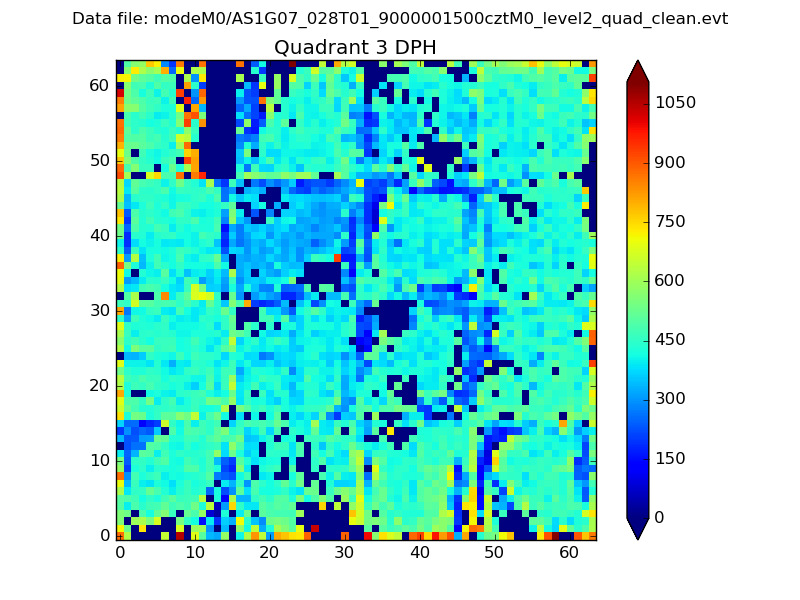 |
 |
Quadrant C |
| Plot type | Count rate plots | Images |
|---|---|---|
| Comparison with Poisson distribution Blue bars denote a histogram of data divided into 1 sec bins. Red curve is a Poisson curve with rate = median count rate of data. |
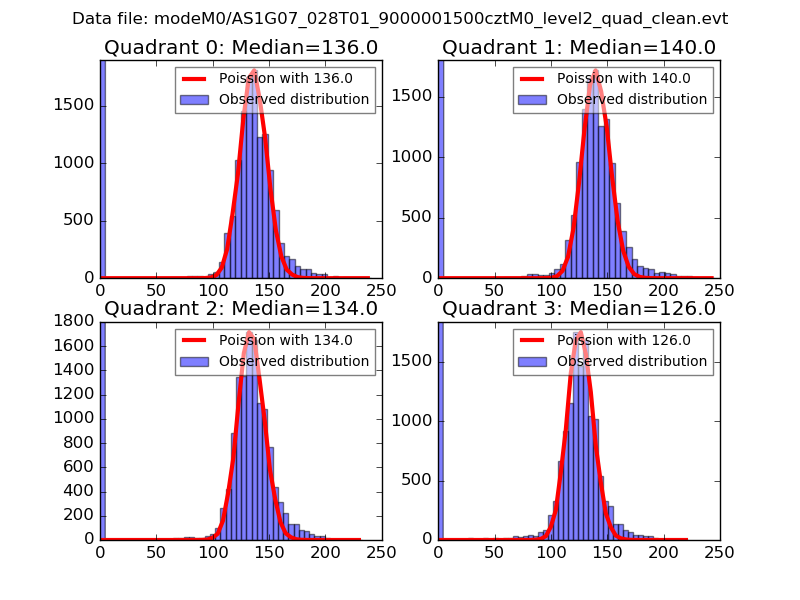 |
 |
| Quadrant-wise count rates Data is divided into 100 sec bins |
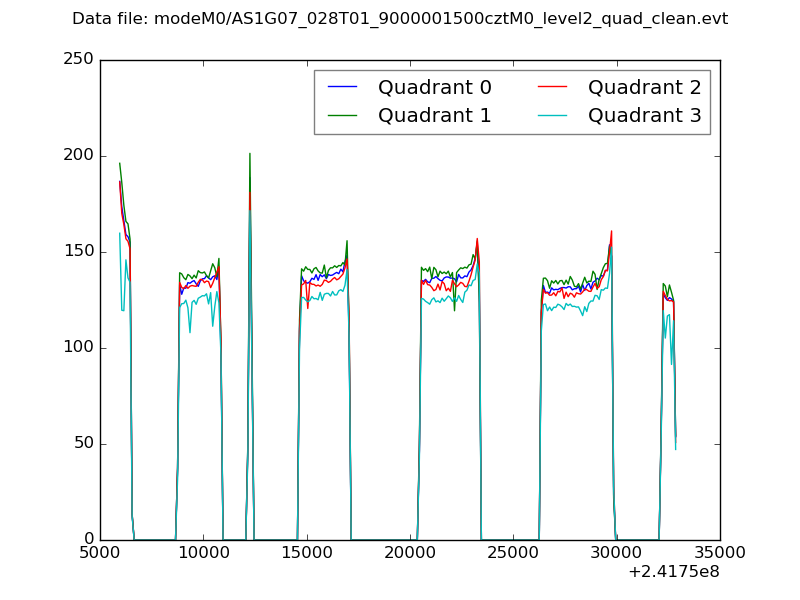 |
|
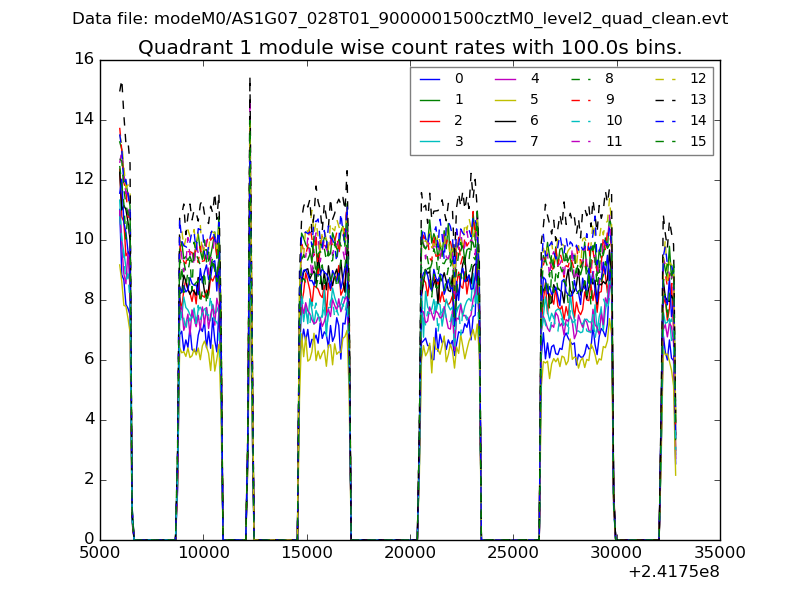
| Module-wise count rates for Quadrant A Data is divided into 100 sec bins |
 |
 |
| Module-wise count rates for Quadrant B Data is divided into 100 sec bins |
 |
 |
| Module-wise count rates for Quadrant C Data is divided into 100 sec bins |
 |
 |
| Module-wise count rates for Quadrant D Data is divided into 100 sec bins |
 |
 |
| Parameter | Plot |
|---|---|
| CZT HV Monitor |  |
| D_VDD |  |
| Temperature 1 |  |
| Veto HV Monitor |  |
| Veto LLD |  |
| Alpha Counter |  |
| _CPM_Rate |  |
| CZT Counter |  |
| +2.5 Volts monitor |  |
| +5 Volts monitor |  |
| _ROLL_ROT | 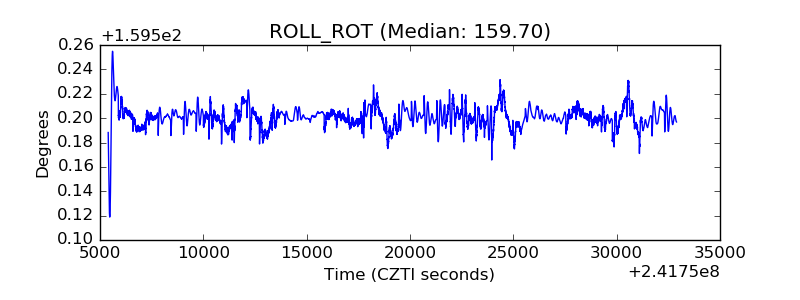 |
| _Roll_DEC |  |
| _Roll_RA | 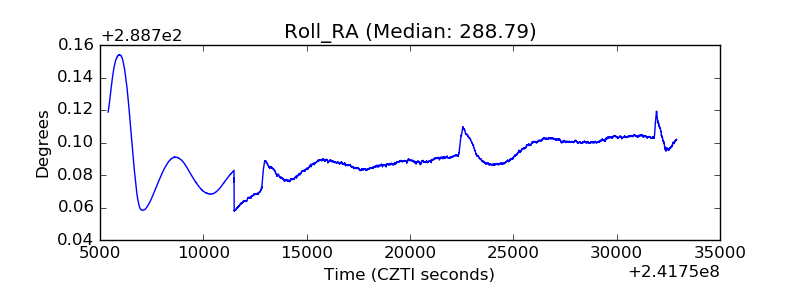 |
| Veto Counter |  |