| Param | Original file | Final file |
|---|---|---|
| Filename | modeM0/AS1G07_048T01_9000001494cztM0_level2_bc.evt | modeM0/AS1G07_048T01_9000001494cztM0_level2_quad_clean.evt |
| Size (bytes) | 230,699,520 | 95,460,480 |
| Size | 220.0 MB | 91.0 MB |
| Events in quadrant A | 1,391,069 | 619,152 |
| Events in quadrant B | 1,522,255 | 616,686 |
| Events in quadrant C | 1,321,637 | 614,754 |
| Events in quadrant D | 2,293,841 | 579,683 |
| Mode M0 | |||
|---|---|---|---|
| Quadrant | BADHDUFLAG | Total packets | Discarded packets |
| A | 1 | 139905839364904 | 46 |
| B | 1 | 139905839364904 | 46 |
| C | 1 | 139905839364904 | 46 |
| D | 1 | 139905839364904 | 46 |
| Mode M9 | |||
|---|---|---|---|
| Quadrant | BADHDUFLAG | Total packets | Discarded packets |
| A | 0 | 121 | 0 |
| B | 0 | 122 | 0 |
| C | 0 | 121 | 0 |
| D | 0 | 121 | 0 |
| Mode SS | |||
|---|---|---|---|
| Quadrant | BADHDUFLAG | Total packets | Discarded packets |
| A | 0 | 792 | 0 |
| B | 0 | 791 | 0 |
| C | 0 | 789 | 0 |
| D | 0 | 795 | 0 |
| Quadrant | Total seconds | Saturated seconds | Saturation percentage |
|---|---|---|---|
| A | 70172 | 712 | 1.014650% |
| B | 68382 | 1007 | 1.472610% |
| C | 70304 | 522 | 0.742490% |
| D | 69839 | 3268 | 4.679334% |
Noise dominated data is calculated using 1-second bins in cleaned event files. If a bin has >2000 counts, and if more than 50% of those come from <1% of pixels, then it is considered to be noise-dominated and hence unusable.
| Quadrant | # 1 sec bins | Bins with >0 counts | Bins with >2000 counts | High rate bins dominated by noise | Noise dominated (total time) | Noise dominated (detector-on time) | Marked lightcurve |
|---|---|---|---|---|---|---|---|
| A | 7640 | 7123 | 0 | 0 | 0.00% | 0.00% | 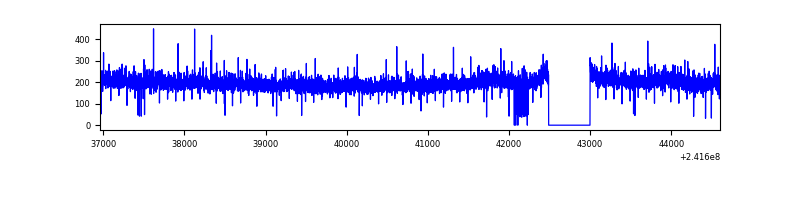 |
| B | 7640 | 7093 | 4 | 4 | 0.05% | 0.06% | 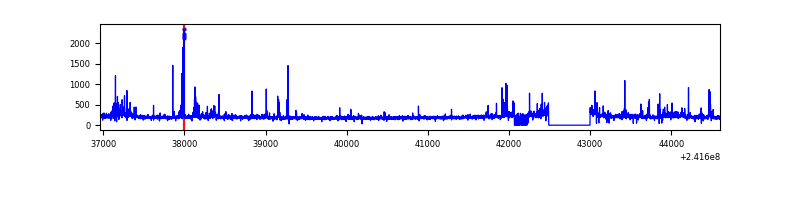 |
| C | 7640 | 7123 | 0 | 0 | 0.00% | 0.00% |  |
| D | 7640 | 7114 | 60 | 60 | 0.79% | 0.84% |  |
Top three noisy pixels from each quadrant. If the there are fewer than three noisy pixels in the level2.evt file, extra rows are filled as -1
| Pixel properties | Quadrant properties | ||||||
|---|---|---|---|---|---|---|---|
| Quadrant | DetID | PixID | Counts | Sigma | Mean | Median | Sigma |
| A | 8 | 15 | 51785 | 648.3 | 341 | 333 | 79.4 |
| A | 13 | 251 | 20999 | 260.39 | 341 | 333 | 79.4 |
| A | 13 | 253 | 3600 | 41.16 | 341 | 333 | 79.4 |
| B | 4 | 239 | 108770 | 1585.55 | 341 | 332 | 68.4 |
| B | 0 | 219 | 35183 | 509.58 | 341 | 332 | 68.4 |
| B | 0 | 214 | 30461 | 440.54 | 341 | 332 | 68.4 |
| C | 14 | 234 | 6530 | 80.75 | 335 | 330 | 76.8 |
| C | 13 | 61 | 2106 | 23.13 | 335 | 330 | 76.8 |
| C | 8 | 222 | 1693 | 17.75 | 335 | 330 | 76.8 |
| D | 1 | 52 | 561729 | 6860.57 | 334 | 321 | 81.8 |
| D | 1 | 20 | 111251 | 1355.6 | 334 | 321 | 81.8 |
| D | 5 | 222 | 105009 | 1279.32 | 334 | 321 | 81.8 |
Histogram calculated using DETX and DETY for each event in the final _common_clean file
| Quadrant A | 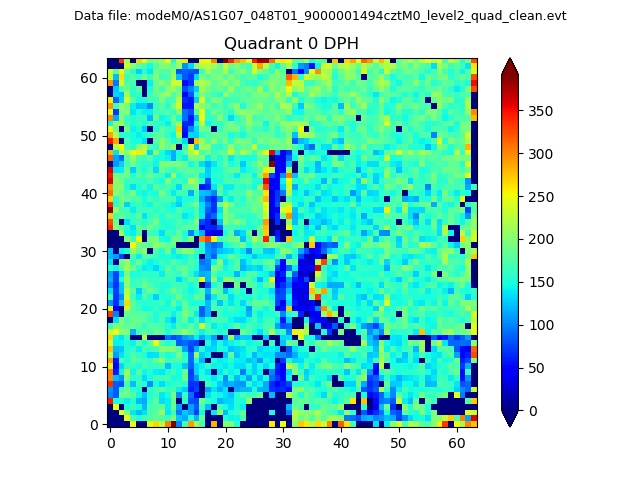 |
 |
Quadrant B |
|---|---|---|---|
| Quadrant D |  |
 |
Quadrant C |
| Plot type | Count rate plots | Images |
|---|---|---|
| Comparison with Poisson distribution Blue bars denote a histogram of data divided into 1 sec bins. Red curve is a Poisson curve with rate = median count rate of data. |
 |
 |
| Quadrant-wise count rates Data is divided into 100 sec bins |
 |
|
| Module-wise count rates for Quadrant A Data is divided into 100 sec bins |
 |
 |
| Module-wise count rates for Quadrant B Data is divided into 100 sec bins |
 |
 |
| Module-wise count rates for Quadrant C Data is divided into 100 sec bins |
 |
 |
| Module-wise count rates for Quadrant D Data is divided into 100 sec bins |
 |
 |
| Parameter | Plot |
|---|---|
| CZT HV Monitor |  |
| D_VDD |  |
| Temperature 1 |  |
| Veto HV Monitor | 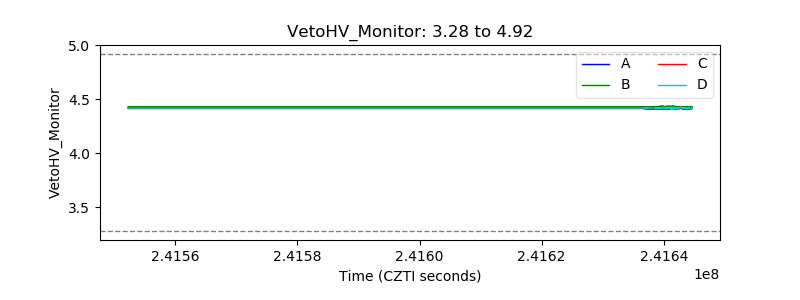 |
| Veto LLD | 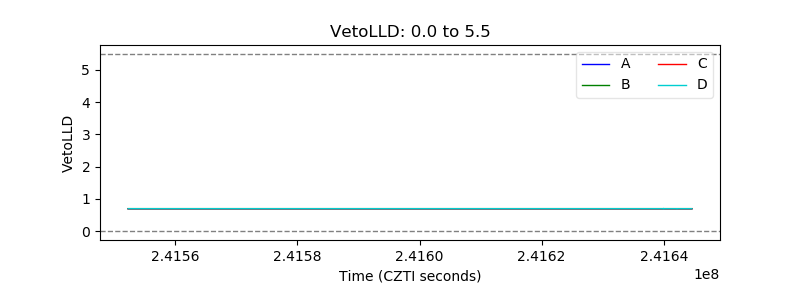 |
| Alpha Counter |  |
| _CPM_Rate |  |
| CZT Counter |  |
| +2.5 Volts monitor | 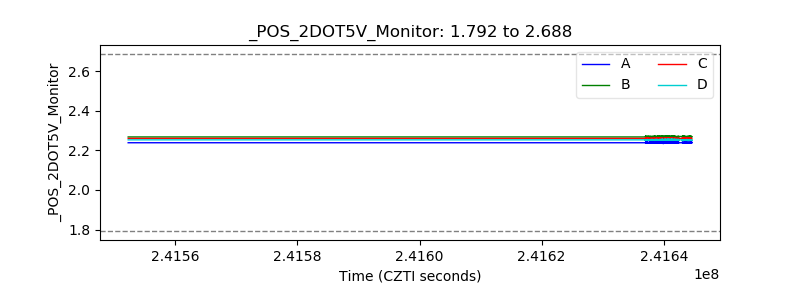 |
| +5 Volts monitor |  |
| _ROLL_ROT |  |
| _Roll_DEC |  |
| _Roll_RA |  |
| Veto Counter |  |