| Param | Original file | Final file |
|---|---|---|
| Filename | modeM0/AS1A03_124T01_9000001486cztM0_level2.evt | modeM0/AS1A03_124T01_9000001486cztM0_level2_quad_clean.evt |
| Size (bytes) | 7,600,800,960 | 1,390,429,440 |
| Size | 7.1 GB | 1.3 GB |
| Events in quadrant A | 53,973,915 | 8,884,790 |
| Events in quadrant B | 58,761,107 | 8,786,251 |
| Events in quadrant C | 49,954,997 | 8,731,129 |
| Events in quadrant D | 60,518,920 | 8,618,235 |
| Mode SS | |||
|---|---|---|---|
| Quadrant | BADHDUFLAG | Total packets | Discarded packets |
| A | 0 | 649 | 0 |
| B | 0 | 607 | 0 |
| C | 0 | 649 | 0 |
| D | 0 | 648 | 0 |
| Mode M9 | |||
|---|---|---|---|
| Quadrant | BADHDUFLAG | Total packets | Discarded packets |
| A | 0 | 206 | 0 |
| B | 0 | 207 | 0 |
| C | 0 | 207 | 0 |
| D | 0 | 207 | 0 |
| Mode M0 | |||
|---|---|---|---|
| Quadrant | BADHDUFLAG | Total packets | Discarded packets |
| A | 0 | 228691 | 0 |
| B | 0 | 243218 | 0 |
| C | 0 | 222628 | 0 |
| D | 0 | 252440 | 0 |
| Quadrant | Total seconds | Saturated seconds | Saturation percentage |
|---|---|---|---|
| A | 107932 | 1303 | 1.207242% |
| B | 106311 | 2503 | 2.354413% |
| C | 108170 | 857 | 0.792271% |
| D | 111676 | 1471 | 1.317203% |
Noise dominated data is calculated using 1-second bins in cleaned event files. If a bin has >2000 counts, and if more than 50% of those come from <1% of pixels, then it is considered to be noise-dominated and hence unusable.
| Quadrant | # 1 sec bins | Bins with >0 counts | Bins with >2000 counts | High rate bins dominated by noise | Noise dominated (total time) | Noise dominated (detector-on time) | Marked lightcurve |
|---|---|---|---|---|---|---|---|
| A | 135202 | 112708 | 97 | 97 | 0.07% | 0.09% |  |
| B | 135201 | 111245 | 891 | 891 | 0.66% | 0.80% |  |
| C | 135202 | 112768 | 88 | 88 | 0.07% | 0.08% |  |
| D | 135202 | 113247 | 606 | 606 | 0.45% | 0.54% |  |
Top three noisy pixels from each quadrant. If the there are fewer than three noisy pixels in the level2.evt file, extra rows are filled as -1
| Pixel properties | Quadrant properties | ||||||
|---|---|---|---|---|---|---|---|
| Quadrant | DetID | PixID | Counts | Sigma | Mean | Median | Sigma |
| A | 8 | 15 | 1900998 | 726.57 | 13064 | 12812 | 2598.8 |
| A | 8 | 5 | 1229008 | 467.99 | 13064 | 12812 | 2598.8 |
| A | 3 | 1 | 266366 | 97.57 | 13064 | 12812 | 2598.8 |
| B | 4 | 239 | 7181389 | 2994.64 | 12819 | 12536 | 2393.9 |
| B | 11 | 51 | 794316 | 326.57 | 12819 | 12536 | 2393.9 |
| B | 0 | 214 | 563153 | 230.01 | 12819 | 12536 | 2393.9 |
| C | 4 | 254 | 405862 | 135.99 | 12647 | 12713 | 2891.0 |
| C | 14 | 234 | 175082 | 56.16 | 12647 | 12713 | 2891.0 |
| C | 13 | 61 | 95012 | 28.47 | 12647 | 12713 | 2891.0 |
| D | 8 | 195 | 4624596 | 1498.63 | 12985 | 12657 | 3077.4 |
| D | 1 | 52 | 2146366 | 693.34 | 12985 | 12657 | 3077.4 |
| D | 2 | 14 | 797982 | 255.19 | 12985 | 12657 | 3077.4 |
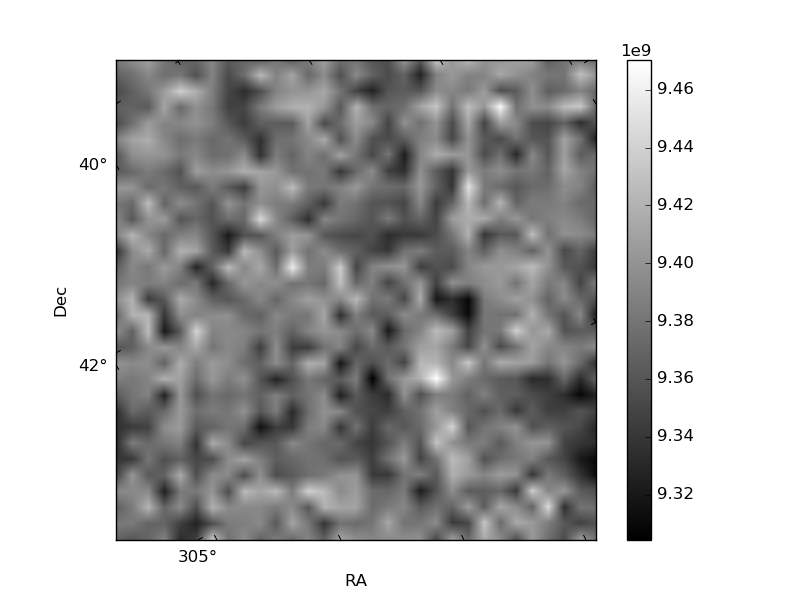
Histogram calculated using DETX and DETY for each event in the final _common_clean file
| Quadrant A |  |
 |
Quadrant B |
|---|---|---|---|
| Quadrant D |  |
 |
Quadrant C |
| Plot type | Count rate plots | Images |
|---|---|---|
| Comparison with Poisson distribution Blue bars denote a histogram of data divided into 1 sec bins. Red curve is a Poisson curve with rate = median count rate of data. |
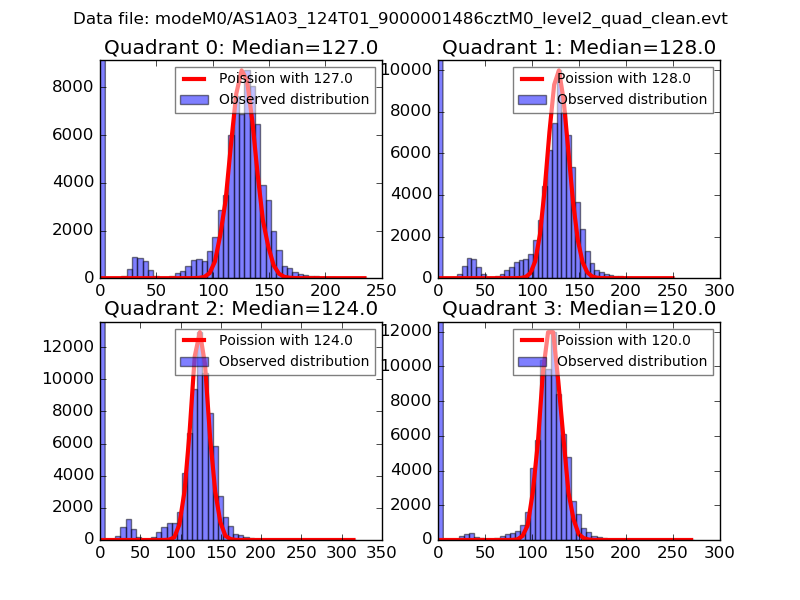 |
 |
| Quadrant-wise count rates Data is divided into 100 sec bins |
 |
|
| Module-wise count rates for Quadrant A Data is divided into 100 sec bins |
 |
 |
| Module-wise count rates for Quadrant B Data is divided into 100 sec bins |
 |
 |
| Module-wise count rates for Quadrant C Data is divided into 100 sec bins |
 |
 |
| Module-wise count rates for Quadrant D Data is divided into 100 sec bins |
 |
 |
| Parameter | Plot |
|---|---|
| CZT HV Monitor | 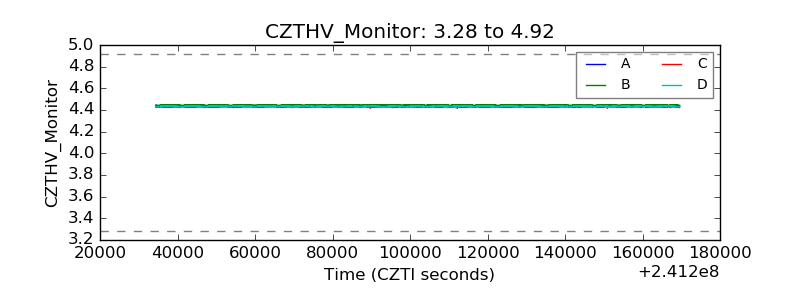 |
| D_VDD |  |
| Temperature 1 | 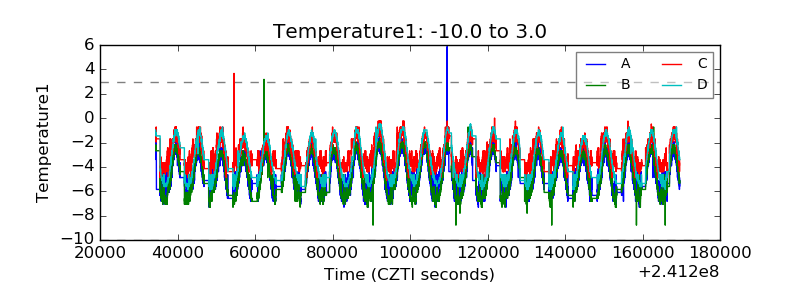 |
| Veto HV Monitor | 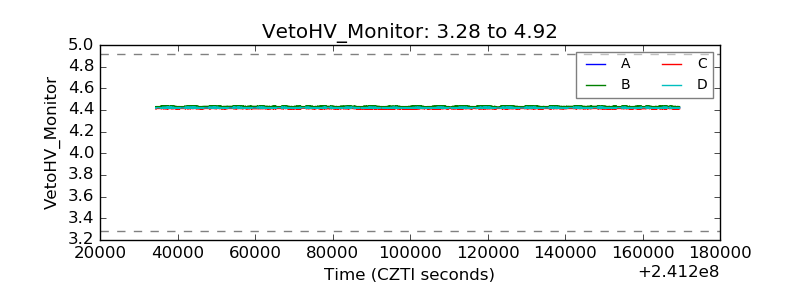 |
| Veto LLD | 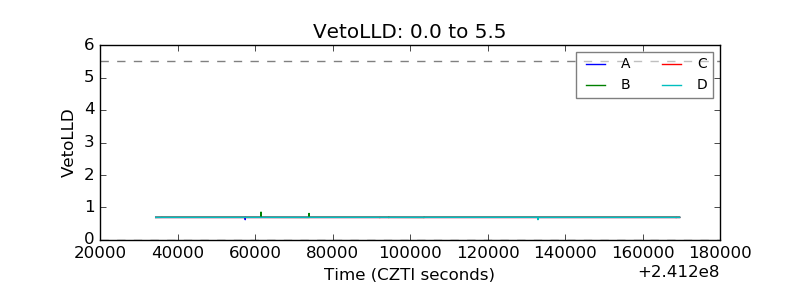 |
| Alpha Counter |  |
| _CPM_Rate | 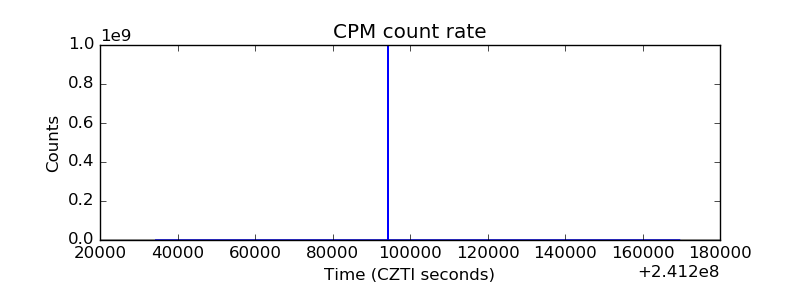 |
| CZT Counter |  |
| +2.5 Volts monitor |  |
| +5 Volts monitor | 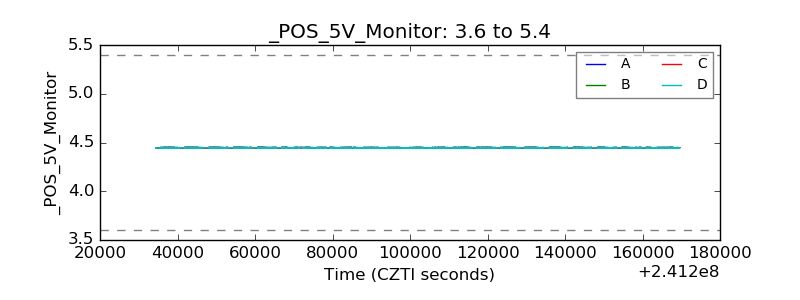 |
| _ROLL_ROT | 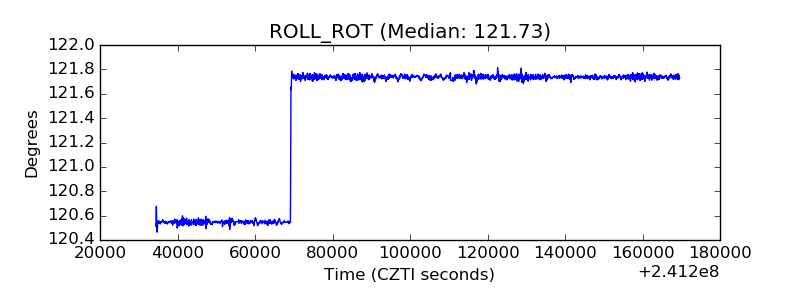 |
| _Roll_DEC |  |
| _Roll_RA |  |
| Veto Counter |  |