| Param | Original file | Final file |
|---|---|---|
| Filename | modeM0/AS1A03_072T01_9000001484cztM0_level2.evt | modeM0/AS1A03_072T01_9000001484cztM0_level2_quad_clean.evt |
| Size (bytes) | 5,631,076,800 | 949,118,400 |
| Size | 5.2 GB | 905.1 MB |
| Events in quadrant A | 37,747,075 | 6,003,585 |
| Events in quadrant B | 41,771,892 | 5,946,469 |
| Events in quadrant C | 37,353,608 | 5,922,808 |
| Events in quadrant D | 48,507,931 | 5,632,658 |
| Mode M0 | |||
|---|---|---|---|
| Quadrant | BADHDUFLAG | Total packets | Discarded packets |
| A | 0 | 161929 | 0 |
| B | 0 | 172151 | 0 |
| C | 0 | 163798 | 0 |
| D | 0 | 193358 | 0 |
| Mode M9 | |||
|---|---|---|---|
| Quadrant | BADHDUFLAG | Total packets | Discarded packets |
| A | 0 | 122 | 0 |
| B | 0 | 122 | 0 |
| C | 0 | 122 | 0 |
| D | 0 | 122 | 0 |
| Mode SS | |||
|---|---|---|---|
| Quadrant | BADHDUFLAG | Total packets | Discarded packets |
| A | 0 | 1622 | 0 |
| B | 0 | 1523 | 0 |
| C | 0 | 1507 | 0 |
| D | 0 | 1618 | 0 |
| Quadrant | Total seconds | Saturated seconds | Saturation percentage |
|---|---|---|---|
| A | 76275 | 1055 | 1.383153% |
| B | 75241 | 1355 | 1.800880% |
| C | 76776 | 878 | 1.143587% |
| D | 77661 | 2145 | 2.762004% |
Noise dominated data is calculated using 1-second bins in cleaned event files. If a bin has >2000 counts, and if more than 50% of those come from <1% of pixels, then it is considered to be noise-dominated and hence unusable.
| Quadrant | # 1 sec bins | Bins with >0 counts | Bins with >2000 counts | High rate bins dominated by noise | Noise dominated (total time) | Noise dominated (detector-on time) | Marked lightcurve |
|---|---|---|---|---|---|---|---|
| A | 93532 | 79511 | 402 | 402 | 0.43% | 0.51% | 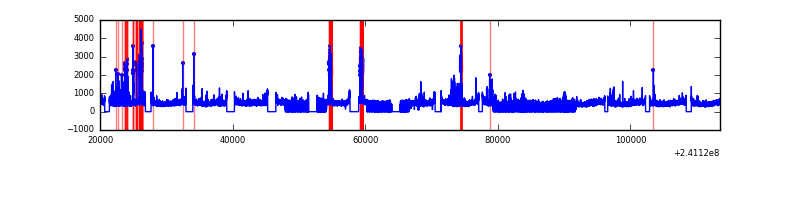 |
| B | 93532 | 78649 | 433 | 433 | 0.46% | 0.55% | 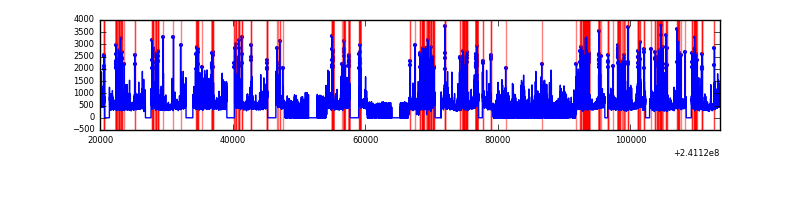 |
| C | 93532 | 79966 | 306 | 306 | 0.33% | 0.38% |  |
| D | 93532 | 79063 | 1612 | 1612 | 1.72% | 2.04% | 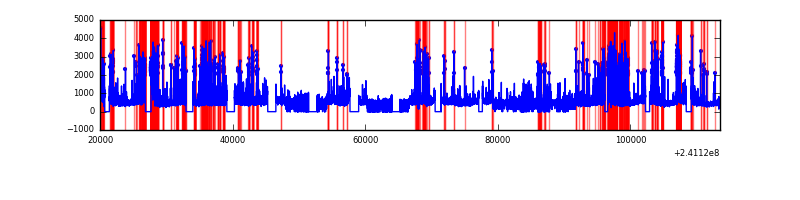 |
Top three noisy pixels from each quadrant. If the there are fewer than three noisy pixels in the level2.evt file, extra rows are filled as -1
| Pixel properties | Quadrant properties | ||||||
|---|---|---|---|---|---|---|---|
| Quadrant | DetID | PixID | Counts | Sigma | Mean | Median | Sigma |
| A | 5 | 16 | 1487743 | 801.53 | 9179 | 8999 | 1844.9 |
| A | 8 | 15 | 431265 | 228.88 | 9179 | 8999 | 1844.9 |
| A | 8 | 5 | 340142 | 179.49 | 9179 | 8999 | 1844.9 |
| B | 4 | 239 | 3822394 | 2234.06 | 9070 | 8874 | 1707.0 |
| B | 11 | 51 | 884750 | 513.11 | 9070 | 8874 | 1707.0 |
| B | 10 | 247 | 585155 | 337.6 | 9070 | 8874 | 1707.0 |
| C | 4 | 254 | 2563387 | 1244.83 | 8904 | 8949 | 2052.0 |
| C | 13 | 61 | 67199 | 28.39 | 8904 | 8949 | 2052.0 |
| C | 14 | 234 | 50806 | 20.4 | 8904 | 8949 | 2052.0 |
| D | 8 | 195 | 4098938 | 1845.06 | 8934 | 8708 | 2216.9 |
| D | 12 | 233 | 3056117 | 1374.66 | 8934 | 8708 | 2216.9 |
| D | 13 | 104 | 2206816 | 991.54 | 8934 | 8708 | 2216.9 |
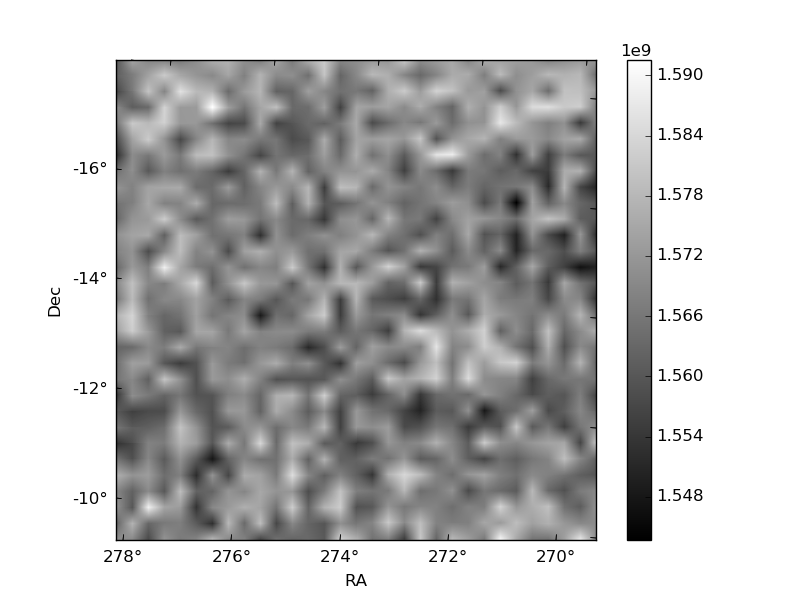
Histogram calculated using DETX and DETY for each event in the final _common_clean file
| Quadrant A |  |
 |
Quadrant B |
|---|---|---|---|
| Quadrant D |  |
 |
Quadrant C |
| Plot type | Count rate plots | Images |
|---|---|---|
| Comparison with Poisson distribution Blue bars denote a histogram of data divided into 1 sec bins. Red curve is a Poisson curve with rate = median count rate of data. |
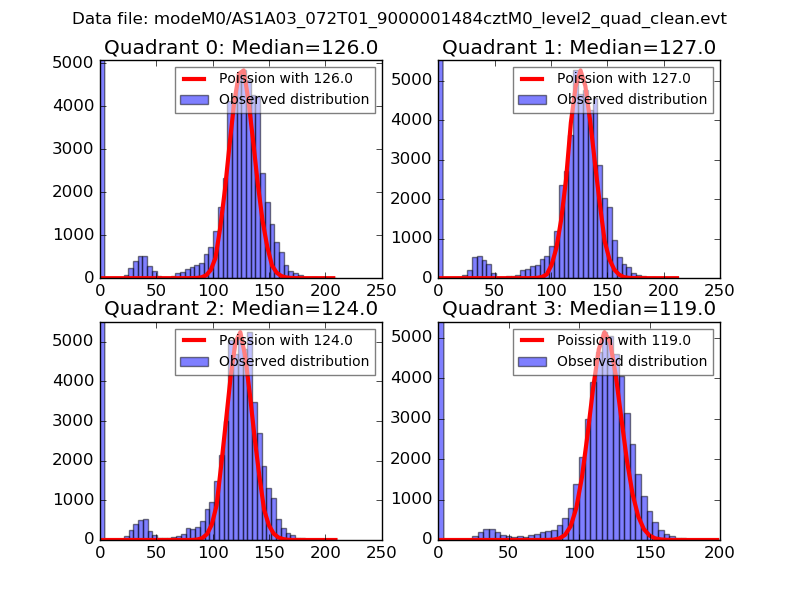 |
 |
| Quadrant-wise count rates Data is divided into 100 sec bins |
 |
|
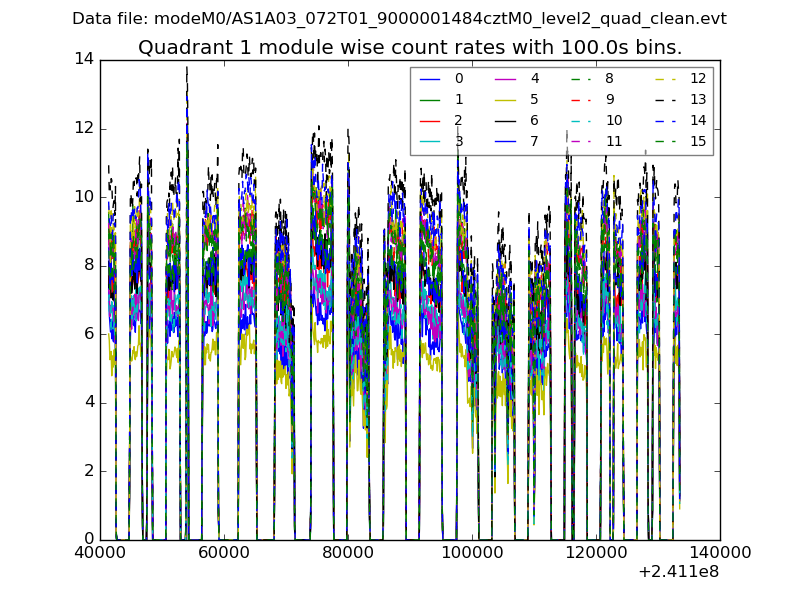
| Module-wise count rates for Quadrant A Data is divided into 100 sec bins |
 |
 |
| Module-wise count rates for Quadrant B Data is divided into 100 sec bins |
 |
 |
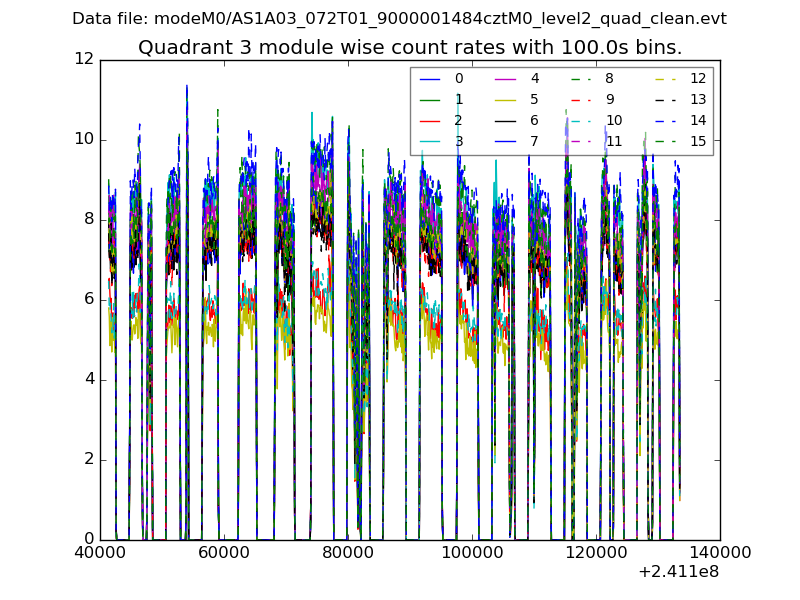
| Module-wise count rates for Quadrant C Data is divided into 100 sec bins |
 |
 |
| Module-wise count rates for Quadrant D Data is divided into 100 sec bins |
 |
 |
| Parameter | Plot |
|---|---|
| CZT HV Monitor | 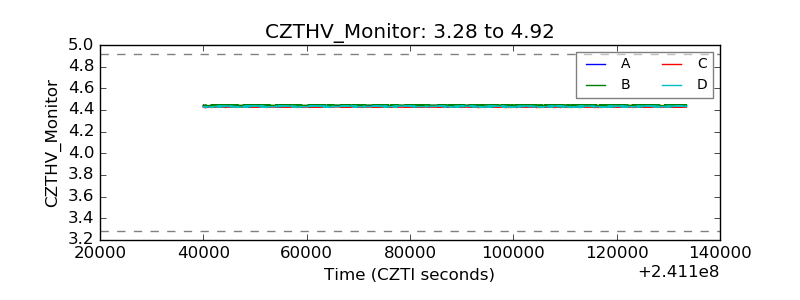 |
| D_VDD |  |
| Temperature 1 | 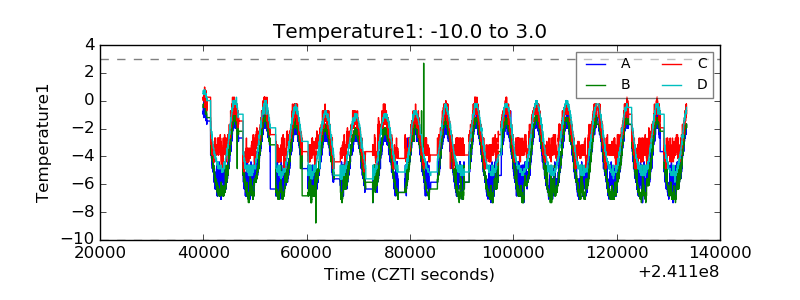 |
| Veto HV Monitor | 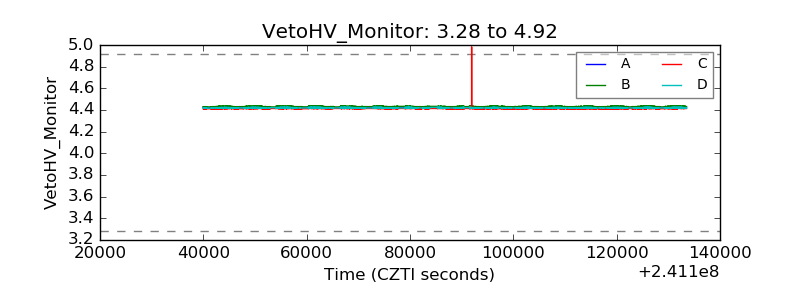 |
| Veto LLD |  |
| Alpha Counter |  |
| _CPM_Rate |  |
| CZT Counter | 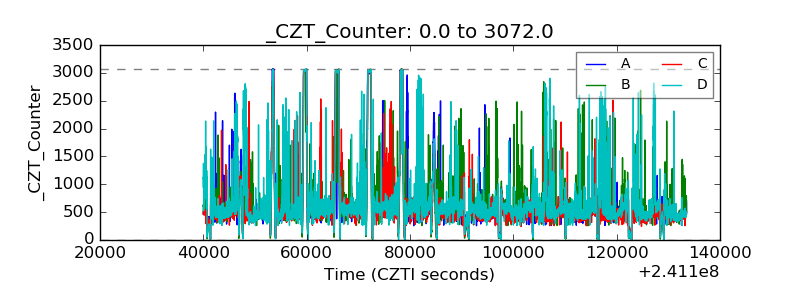 |
| +2.5 Volts monitor |  |
| +5 Volts monitor |  |
| _ROLL_ROT | 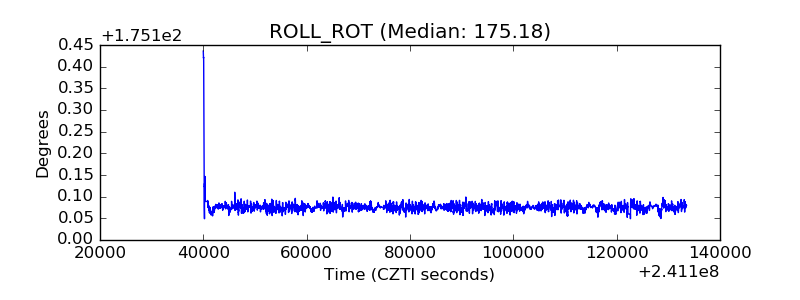 |
| _Roll_DEC | 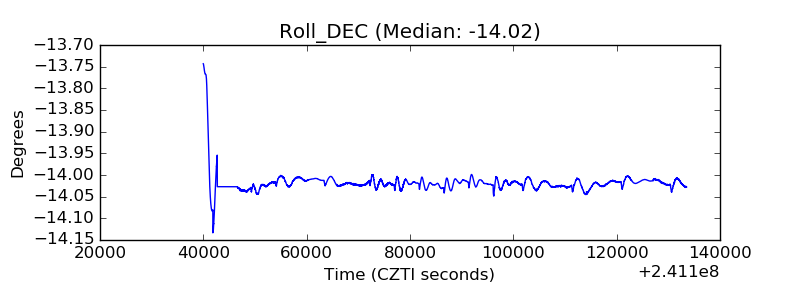 |
| _Roll_RA |  |
| Veto Counter |  |