| Param | Original file | Final file |
|---|---|---|
| Filename | modeM0/AS1C02_021T01_9000001482cztM0_level2.evt | modeM0/AS1C02_021T01_9000001482cztM0_level2_quad_clean.evt |
| Size (bytes) | 4,495,481,280 | 979,787,520 |
| Size | 4.2 GB | 934.4 MB |
| Events in quadrant A | 31,135,961 | 6,420,716 |
| Events in quadrant B | 33,785,293 | 6,389,779 |
| Events in quadrant C | 28,881,525 | 6,356,265 |
| Events in quadrant D | 37,970,972 | 6,070,245 |
| Mode M9 | |||
|---|---|---|---|
| Quadrant | BADHDUFLAG | Total packets | Discarded packets |
| A | 0 | 85 | 0 |
| B | 0 | 85 | 0 |
| C | 0 | 85 | 0 |
| D | 0 | 85 | 0 |
| Mode M0 | |||
|---|---|---|---|
| Quadrant | BADHDUFLAG | Total packets | Discarded packets |
| A | 0 | 137135 | 0 |
| B | 0 | 143282 | 0 |
| C | 0 | 133600 | 0 |
| D | 0 | 155090 | 0 |
| Mode SS | |||
|---|---|---|---|
| Quadrant | BADHDUFLAG | Total packets | Discarded packets |
| A | 0 | 1292 | 0 |
| B | 0 | 1059 | 0 |
| C | 0 | 1284 | 0 |
| D | 0 | 1295 | 0 |
| Quadrant | Total seconds | Saturated seconds | Saturation percentage |
|---|---|---|---|
| A | 65076 | 644 | 0.989612% |
| B | 64666 | 1007 | 1.557233% |
| C | 65360 | 407 | 0.622705% |
| D | 65120 | 1298 | 1.993243% |
Noise dominated data is calculated using 1-second bins in cleaned event files. If a bin has >2000 counts, and if more than 50% of those come from <1% of pixels, then it is considered to be noise-dominated and hence unusable.
| Quadrant | # 1 sec bins | Bins with >0 counts | Bins with >2000 counts | High rate bins dominated by noise | Noise dominated (total time) | Noise dominated (detector-on time) | Marked lightcurve |
|---|---|---|---|---|---|---|---|
| A | 102151 | 67445 | 118 | 118 | 0.12% | 0.17% |  |
| B | 102149 | 67088 | 257 | 257 | 0.25% | 0.38% |  |
| C | 102151 | 67569 | 20 | 20 | 0.02% | 0.03% |  |
| D | 102151 | 66280 | 803 | 803 | 0.79% | 1.21% |  |
Top three noisy pixels from each quadrant. If the there are fewer than three noisy pixels in the level2.evt file, extra rows are filled as -1
| Pixel properties | Quadrant properties | ||||||
|---|---|---|---|---|---|---|---|
| Quadrant | DetID | PixID | Counts | Sigma | Mean | Median | Sigma |
| A | 8 | 15 | 908553 | 595.4 | 7587 | 7427 | 1513.5 |
| A | 8 | 5 | 627570 | 409.75 | 7587 | 7427 | 1513.5 |
| A | 15 | 174 | 164630 | 103.87 | 7587 | 7427 | 1513.5 |
| B | 4 | 239 | 1863723 | 1341.85 | 7480 | 7306 | 1383.5 |
| B | 11 | 51 | 1237931 | 889.52 | 7480 | 7306 | 1383.5 |
| B | 0 | 85 | 403434 | 286.33 | 7480 | 7306 | 1383.5 |
| C | 4 | 254 | 134559 | 75.69 | 7350 | 7386 | 1680.1 |
| C | 13 | 61 | 55557 | 28.67 | 7350 | 7386 | 1680.1 |
| C | 14 | 67 | 37015 | 17.64 | 7350 | 7386 | 1680.1 |
| D | 8 | 195 | 3478567 | 1989.0 | 7335 | 7134 | 1745.3 |
| D | 1 | 52 | 1851384 | 1056.68 | 7335 | 7134 | 1745.3 |
| D | 12 | 233 | 1144935 | 651.92 | 7335 | 7134 | 1745.3 |
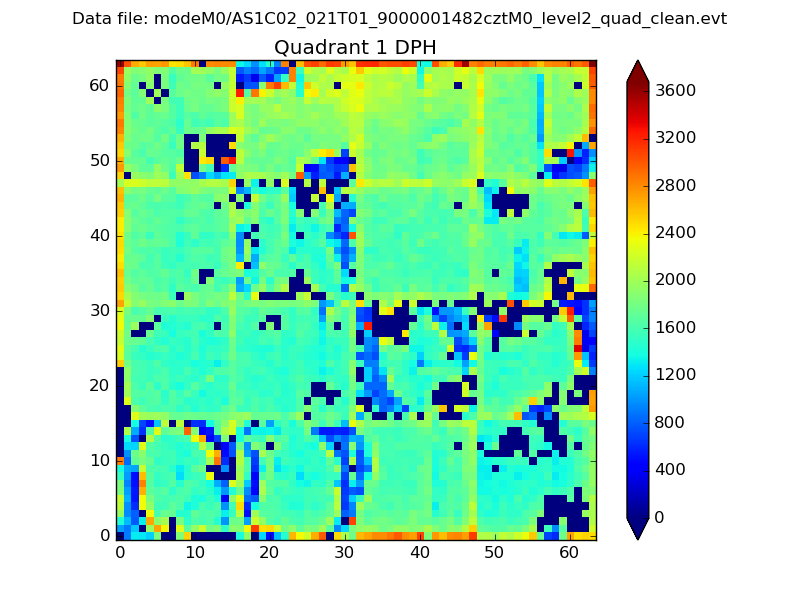
Histogram calculated using DETX and DETY for each event in the final _common_clean file
| Quadrant A |  |
 |
Quadrant B |
|---|---|---|---|
| Quadrant D | 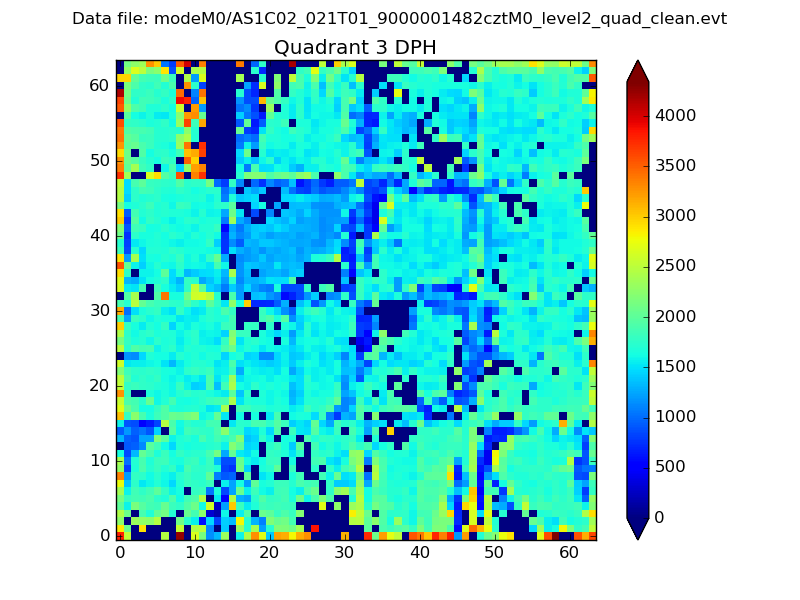 |
 |
Quadrant C |
| Plot type | Count rate plots | Images |
|---|---|---|
| Comparison with Poisson distribution Blue bars denote a histogram of data divided into 1 sec bins. Red curve is a Poisson curve with rate = median count rate of data. |
 |
 |
| Quadrant-wise count rates Data is divided into 100 sec bins |
 |
|
| Module-wise count rates for Quadrant A Data is divided into 100 sec bins |
 |
 |
| Module-wise count rates for Quadrant B Data is divided into 100 sec bins |
 |
 |
| Module-wise count rates for Quadrant C Data is divided into 100 sec bins |
 |
 |
| Module-wise count rates for Quadrant D Data is divided into 100 sec bins |
 |
 |
| Parameter | Plot |
|---|---|
| CZT HV Monitor | 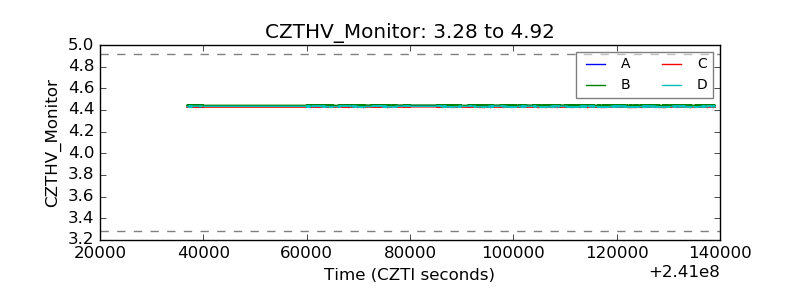 |
| D_VDD |  |
| Temperature 1 | 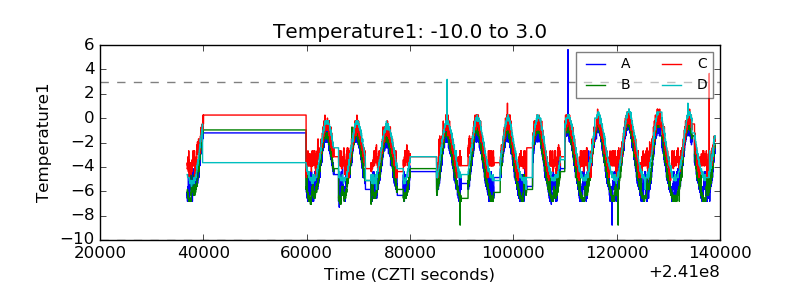 |
| Veto HV Monitor |  |
| Veto LLD |  |
| Alpha Counter |  |
| _CPM_Rate |  |
| CZT Counter | 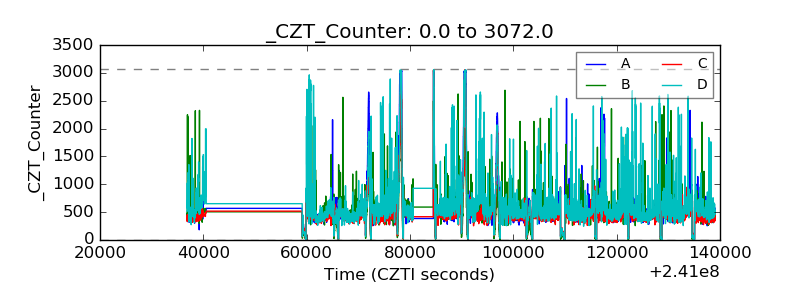 |
| +2.5 Volts monitor | 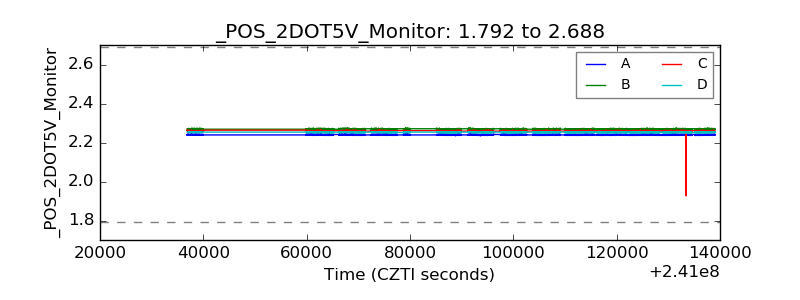 |
| +5 Volts monitor |  |
| _ROLL_ROT |  |
| _Roll_DEC |  |
| _Roll_RA |  |
| Veto Counter |  |