| Param | Original file | Final file |
|---|---|---|
| Filename | modeM0/AS1G07_011T03_9000001476cztM0_level2.evt | modeM0/AS1G07_011T03_9000001476cztM0_level2_quad_clean.evt |
| Size (bytes) | 1,854,149,760 | 336,718,080 |
| Size | 1.7 GB | 321.1 MB |
| Events in quadrant A | 12,260,263 | 2,153,589 |
| Events in quadrant B | 13,744,652 | 2,154,451 |
| Events in quadrant C | 11,925,524 | 2,153,222 |
| Events in quadrant D | 16,523,354 | 2,005,669 |
| Mode M9 | |||
|---|---|---|---|
| Quadrant | BADHDUFLAG | Total packets | Discarded packets |
| A | 0 | 59 | 0 |
| B | 0 | 59 | 0 |
| C | 0 | 59 | 0 |
| D | 0 | 59 | 0 |
| Mode SS | |||
|---|---|---|---|
| Quadrant | BADHDUFLAG | Total packets | Discarded packets |
| A | 0 | 516 | 0 |
| B | 0 | 520 | 0 |
| C | 0 | 520 | 0 |
| D | 0 | 524 | 0 |
| Mode M0 | |||
|---|---|---|---|
| Quadrant | BADHDUFLAG | Total packets | Discarded packets |
| A | 0 | 52193 | 0 |
| B | 0 | 56408 | 0 |
| C | 0 | 51910 | 0 |
| D | 0 | 65272 | 0 |
| Quadrant | Total seconds | Saturated seconds | Saturation percentage |
|---|---|---|---|
| A | 25218 | 156 | 0.618606% |
| B | 25121 | 383 | 1.524621% |
| C | 25243 | 143 | 0.566494% |
| D | 25056 | 414 | 1.652299% |
Noise dominated data is calculated using 1-second bins in cleaned event files. If a bin has >2000 counts, and if more than 50% of those come from <1% of pixels, then it is considered to be noise-dominated and hence unusable.
| Quadrant | # 1 sec bins | Bins with >0 counts | Bins with >2000 counts | High rate bins dominated by noise | Noise dominated (total time) | Noise dominated (detector-on time) | Marked lightcurve |
|---|---|---|---|---|---|---|---|
| A | 31744 | 25692 | 2 | 2 | 0.01% | 0.01% |  |
| B | 31740 | 25633 | 127 | 127 | 0.40% | 0.50% | 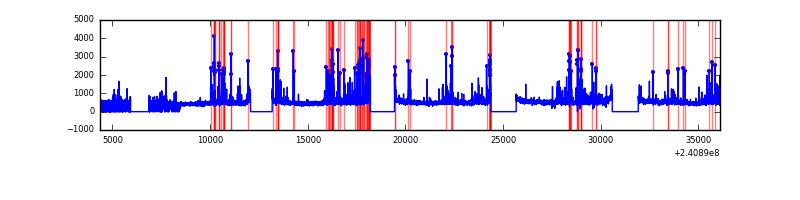 |
| C | 31743 | 25699 | 0 | 0 | 0.00% | 0.00% |  |
| D | 31742 | 25384 | 233 | 233 | 0.73% | 0.92% |  |
Top three noisy pixels from each quadrant. If the there are fewer than three noisy pixels in the level2.evt file, extra rows are filled as -1
| Pixel properties | Quadrant properties | ||||||
|---|---|---|---|---|---|---|---|
| Quadrant | DetID | PixID | Counts | Sigma | Mean | Median | Sigma |
| A | 8 | 15 | 64896 | 98.55 | 3151 | 3092 | 627.1 |
| A | 0 | 226 | 29075 | 41.43 | 3151 | 3092 | 627.1 |
| A | 12 | 194 | 25906 | 36.38 | 3151 | 3092 | 627.1 |
| B | 10 | 247 | 664793 | 1133.66 | 3129 | 3060 | 583.7 |
| B | 11 | 51 | 287281 | 486.92 | 3129 | 3060 | 583.7 |
| B | 0 | 219 | 222682 | 376.25 | 3129 | 3060 | 583.7 |
| C | 0 | 207 | 43671 | 58.77 | 3035 | 3057 | 691.0 |
| C | 13 | 61 | 22477 | 28.1 | 3035 | 3057 | 691.0 |
| C | 14 | 67 | 19207 | 23.37 | 3035 | 3057 | 691.0 |
| D | 1 | 52 | 2211667 | 2849.99 | 2977 | 2928 | 775.0 |
| D | 8 | 195 | 2006065 | 2584.7 | 2977 | 2928 | 775.0 |
| D | 13 | 104 | 152412 | 192.88 | 2977 | 2928 | 775.0 |
Histogram calculated using DETX and DETY for each event in the final _common_clean file
| Quadrant A |  |
 |
Quadrant B |
|---|---|---|---|
| Quadrant D | 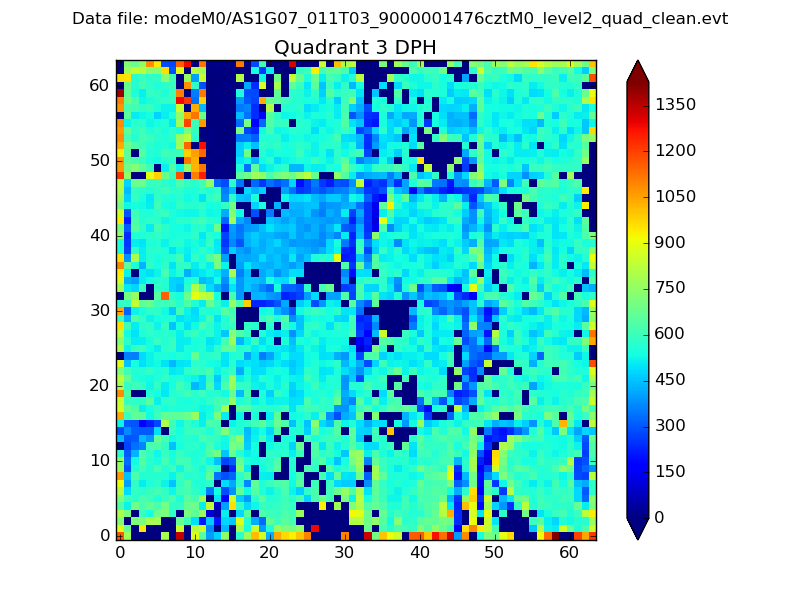 |
 |
Quadrant C |
| Plot type | Count rate plots | Images |
|---|---|---|
| Comparison with Poisson distribution Blue bars denote a histogram of data divided into 1 sec bins. Red curve is a Poisson curve with rate = median count rate of data. |
 |
 |
| Quadrant-wise count rates Data is divided into 100 sec bins |
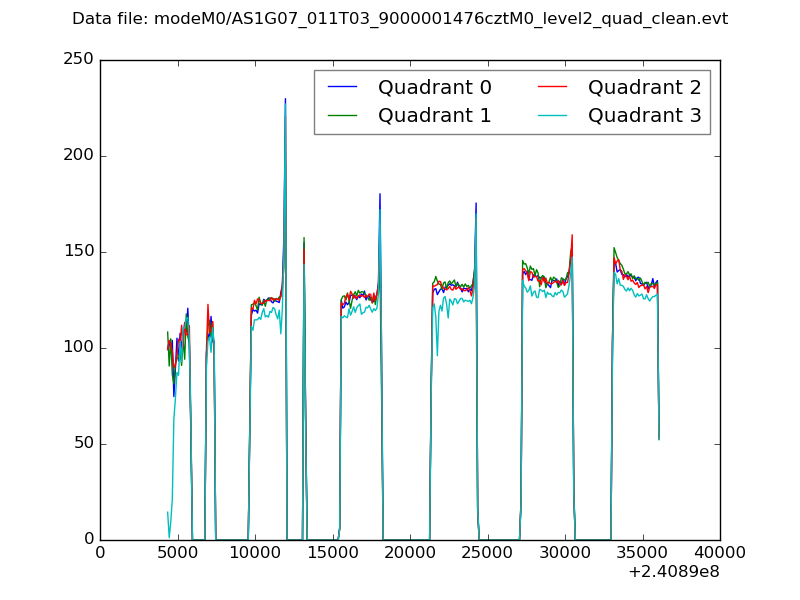 |
|
| Module-wise count rates for Quadrant A Data is divided into 100 sec bins |
 |
 |
| Module-wise count rates for Quadrant B Data is divided into 100 sec bins |
 |
 |
| Module-wise count rates for Quadrant C Data is divided into 100 sec bins |
 |
 |
| Module-wise count rates for Quadrant D Data is divided into 100 sec bins |
 |
 |
| Parameter | Plot |
|---|---|
| CZT HV Monitor |  |
| D_VDD |  |
| Temperature 1 | 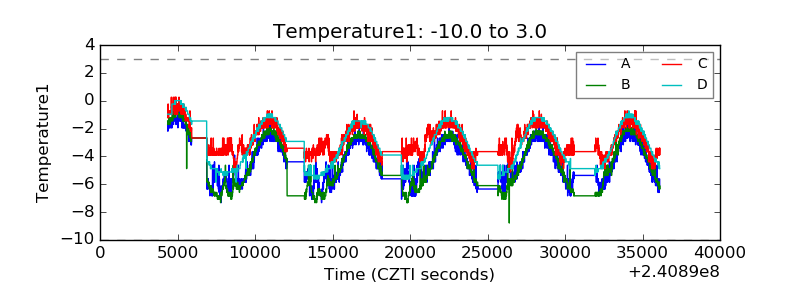 |
| Veto HV Monitor |  |
| Veto LLD |  |
| Alpha Counter |  |
| _CPM_Rate |  |
| CZT Counter | 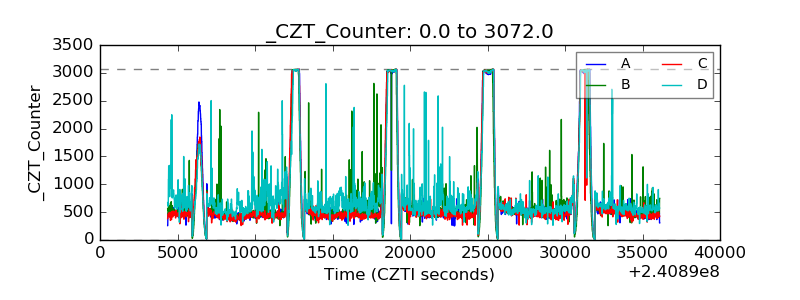 |
| +2.5 Volts monitor |  |
| +5 Volts monitor |  |
| _ROLL_ROT |  |
| _Roll_DEC |  |
| _Roll_RA |  |
| Veto Counter |  |