| Param | Original file | Final file |
|---|---|---|
| Filename | modeM0/AS1A03_069T03_9000001478cztM0_level2.evt | modeM0/AS1A03_069T03_9000001478cztM0_level2_quad_clean.evt |
| Size (bytes) | 956,350,080 | 151,355,520 |
| Size | 912.0 MB | 144.3 MB |
| Events in quadrant A | 6,425,626 | 936,223 |
| Events in quadrant B | 7,139,352 | 936,060 |
| Events in quadrant C | 6,169,180 | 914,936 |
| Events in quadrant D | 8,328,283 | 876,725 |
| Mode SS | |||
|---|---|---|---|
| Quadrant | BADHDUFLAG | Total packets | Discarded packets |
| A | 0 | 270 | 0 |
| B | 0 | 270 | 0 |
| C | 0 | 270 | 0 |
| D | 0 | 270 | 0 |
| Mode M9 | |||
|---|---|---|---|
| Quadrant | BADHDUFLAG | Total packets | Discarded packets |
| A | 0 | 27 | 0 |
| B | 0 | 27 | 0 |
| C | 0 | 27 | 0 |
| D | 0 | 27 | 0 |
| Mode M0 | |||
|---|---|---|---|
| Quadrant | BADHDUFLAG | Total packets | Discarded packets |
| A | 0 | 27771 | 0 |
| B | 0 | 29604 | 0 |
| C | 0 | 27405 | 0 |
| D | 0 | 33388 | 0 |
| Quadrant | Total seconds | Saturated seconds | Saturation percentage |
|---|---|---|---|
| A | 13316 | 227 | 1.704716% |
| B | 13313 | 303 | 2.275971% |
| C | 13312 | 136 | 1.021635% |
| D | 13317 | 264 | 1.982428% |
Noise dominated data is calculated using 1-second bins in cleaned event files. If a bin has >2000 counts, and if more than 50% of those come from <1% of pixels, then it is considered to be noise-dominated and hence unusable.
| Quadrant | # 1 sec bins | Bins with >0 counts | Bins with >2000 counts | High rate bins dominated by noise | Noise dominated (total time) | Noise dominated (detector-on time) | Marked lightcurve |
|---|---|---|---|---|---|---|---|
| A | 15261 | 13322 | 3 | 3 | 0.02% | 0.02% |  |
| B | 15261 | 13322 | 32 | 32 | 0.21% | 0.24% |  |
| C | 15261 | 13322 | 0 | 0 | 0.00% | 0.00% |  |
| D | 15261 | 13322 | 69 | 69 | 0.45% | 0.52% |  |
Top three noisy pixels from each quadrant. If the there are fewer than three noisy pixels in the level2.evt file, extra rows are filled as -1
| Pixel properties | Quadrant properties | ||||||
|---|---|---|---|---|---|---|---|
| Quadrant | DetID | PixID | Counts | Sigma | Mean | Median | Sigma |
| A | 8 | 15 | 81440 | 244.42 | 1629 | 1595 | 326.7 |
| A | 15 | 174 | 39815 | 117.0 | 1629 | 1595 | 326.7 |
| A | 3 | 1 | 29378 | 85.05 | 1629 | 1595 | 326.7 |
| B | 11 | 51 | 337226 | 1093.34 | 1621 | 1582 | 307.0 |
| B | 4 | 239 | 150946 | 486.55 | 1621 | 1582 | 307.0 |
| B | 10 | 247 | 115318 | 370.49 | 1621 | 1582 | 307.0 |
| C | 0 | 207 | 25933 | 67.57 | 1572 | 1583 | 360.4 |
| C | 13 | 61 | 11811 | 28.38 | 1572 | 1583 | 360.4 |
| C | 14 | 67 | 10024 | 23.42 | 1572 | 1583 | 360.4 |
| D | 8 | 195 | 1480137 | 3969.65 | 1566 | 1525 | 372.5 |
| D | 1 | 52 | 309485 | 826.78 | 1566 | 1525 | 372.5 |
| D | 7 | 71 | 183459 | 488.44 | 1566 | 1525 | 372.5 |
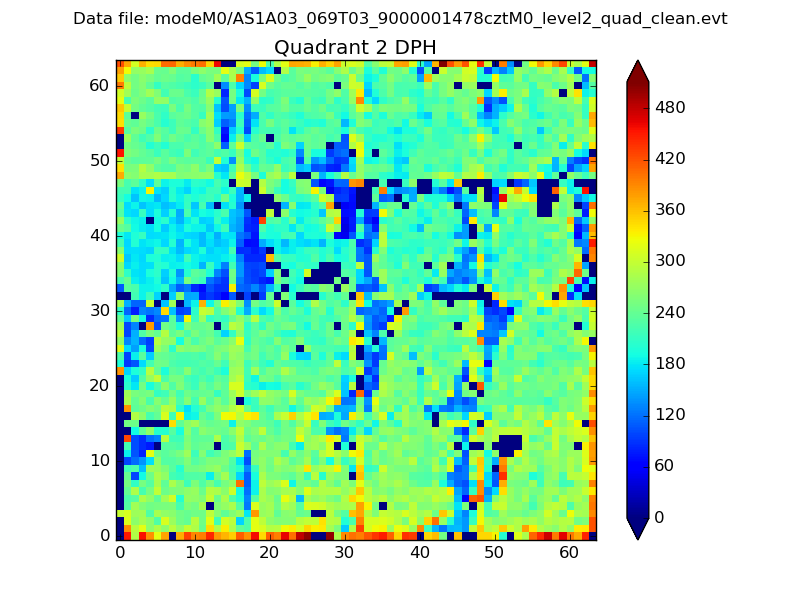
Histogram calculated using DETX and DETY for each event in the final _common_clean file
| Quadrant A |  |
 |
Quadrant B |
|---|---|---|---|
| Quadrant D | 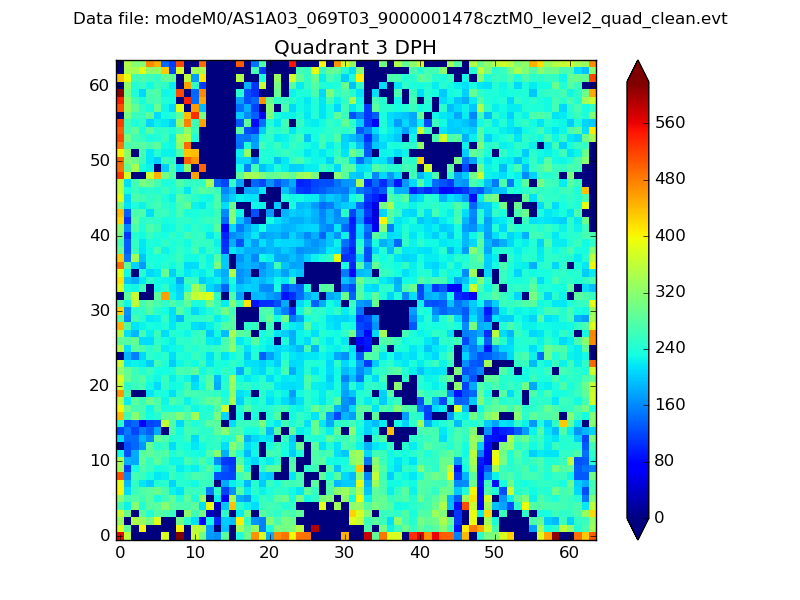 |
 |
Quadrant C |
| Plot type | Count rate plots | Images |
|---|---|---|
| Comparison with Poisson distribution Blue bars denote a histogram of data divided into 1 sec bins. Red curve is a Poisson curve with rate = median count rate of data. |
 |
 |
| Quadrant-wise count rates Data is divided into 100 sec bins |
 |
|
| Module-wise count rates for Quadrant A Data is divided into 100 sec bins |
 |
 |
| Module-wise count rates for Quadrant B Data is divided into 100 sec bins |
 |
 |
| Module-wise count rates for Quadrant C Data is divided into 100 sec bins |
 |
 |
| Module-wise count rates for Quadrant D Data is divided into 100 sec bins |
 |
 |
| Parameter | Plot |
|---|---|
| CZT HV Monitor |  |
| D_VDD |  |
| Temperature 1 |  |
| Veto HV Monitor |  |
| Veto LLD |  |
| Alpha Counter |  |
| _CPM_Rate |  |
| CZT Counter |  |
| +2.5 Volts monitor |  |
| +5 Volts monitor |  |
| _ROLL_ROT |  |
| _Roll_DEC |  |
| _Roll_RA |  |
| Veto Counter |  |