| Param | Original file | Final file |
|---|---|---|
| Filename | modeM0/AS1A03_052T01_9000001480cztM0_level2.evt | modeM0/AS1A03_052T01_9000001480cztM0_level2_quad_clean.evt |
| Size (bytes) | 5,218,338,240 | 928,172,160 |
| Size | 4.9 GB | 885.2 MB |
| Events in quadrant A | 34,865,055 | 5,860,785 |
| Events in quadrant B | 38,304,088 | 5,807,438 |
| Events in quadrant C | 33,192,632 | 5,811,057 |
| Events in quadrant D | 46,806,674 | 5,688,184 |
| Mode SS | |||
|---|---|---|---|
| Quadrant | BADHDUFLAG | Total packets | Discarded packets |
| A | 0 | 1374 | 0 |
| B | 0 | 1267 | 0 |
| C | 0 | 1285 | 0 |
| D | 0 | 1384 | 0 |
| Mode M9 | |||
|---|---|---|---|
| Quadrant | BADHDUFLAG | Total packets | Discarded packets |
| A | 0 | 115 | 0 |
| B | 0 | 115 | 0 |
| C | 0 | 115 | 0 |
| D | 0 | 115 | 0 |
| Mode M0 | |||
|---|---|---|---|
| Quadrant | BADHDUFLAG | Total packets | Discarded packets |
| A | 0 | 150843 | 0 |
| B | 0 | 159329 | 0 |
| C | 0 | 149319 | 0 |
| D | 0 | 187886 | 0 |
| Quadrant | Total seconds | Saturated seconds | Saturation percentage |
|---|---|---|---|
| A | 72169 | 663 | 0.918677% |
| B | 71339 | 1161 | 1.627441% |
| C | 72733 | 411 | 0.565080% |
| D | 74414 | 1442 | 1.937807% |
Noise dominated data is calculated using 1-second bins in cleaned event files. If a bin has >2000 counts, and if more than 50% of those come from <1% of pixels, then it is considered to be noise-dominated and hence unusable.
| Quadrant | # 1 sec bins | Bins with >0 counts | Bins with >2000 counts | High rate bins dominated by noise | Noise dominated (total time) | Noise dominated (detector-on time) | Marked lightcurve |
|---|---|---|---|---|---|---|---|
| A | 91195 | 77574 | 7 | 7 | 0.01% | 0.01% |  |
| B | 91195 | 76931 | 302 | 302 | 0.33% | 0.39% |  |
| C | 91195 | 77833 | 0 | 0 | 0.00% | 0.00% |  |
| D | 91195 | 77596 | 742 | 742 | 0.81% | 0.96% |  |
Top three noisy pixels from each quadrant. If the there are fewer than three noisy pixels in the level2.evt file, extra rows are filled as -1
| Pixel properties | Quadrant properties | ||||||
|---|---|---|---|---|---|---|---|
| Quadrant | DetID | PixID | Counts | Sigma | Mean | Median | Sigma |
| A | 8 | 15 | 891124 | 499.16 | 8757 | 8586 | 1768.1 |
| A | 15 | 239 | 104529 | 54.26 | 8757 | 8586 | 1768.1 |
| A | 3 | 1 | 102253 | 52.98 | 8757 | 8586 | 1768.1 |
| B | 4 | 239 | 1450374 | 884.47 | 8625 | 8437 | 1630.3 |
| B | 10 | 247 | 840678 | 510.49 | 8625 | 8437 | 1630.3 |
| B | 11 | 51 | 836321 | 507.82 | 8625 | 8437 | 1630.3 |
| C | 13 | 61 | 63972 | 28.42 | 8476 | 8526 | 1951.2 |
| C | 14 | 67 | 62503 | 27.66 | 8476 | 8526 | 1951.2 |
| C | 9 | 68 | 35179 | 13.66 | 8476 | 8526 | 1951.2 |
| D | 8 | 195 | 5681107 | 2521.56 | 8558 | 8389 | 2249.7 |
| D | 1 | 52 | 3335075 | 1478.73 | 8558 | 8389 | 2249.7 |
| D | 2 | 16 | 1146206 | 505.77 | 8558 | 8389 | 2249.7 |
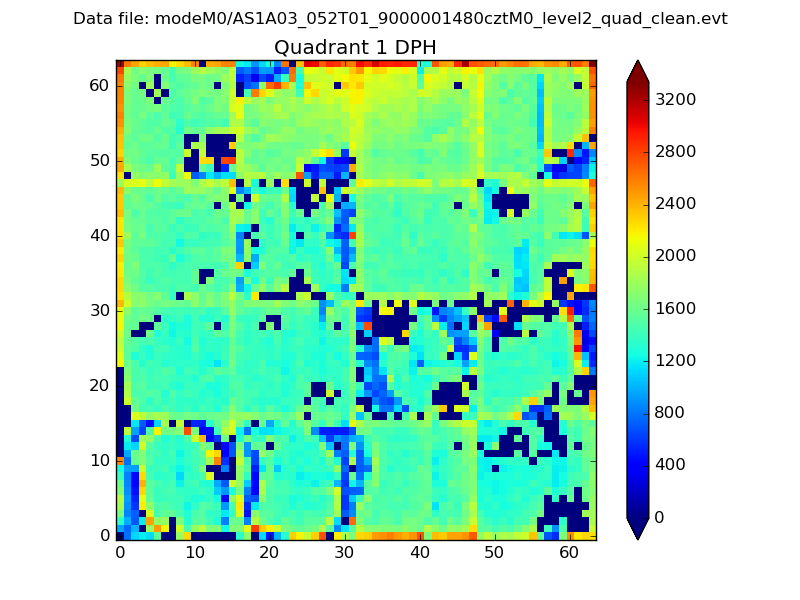
Histogram calculated using DETX and DETY for each event in the final _common_clean file
| Quadrant A |  |
 |
Quadrant B |
|---|---|---|---|
| Quadrant D |  |
 |
Quadrant C |
| Plot type | Count rate plots | Images |
|---|---|---|
| Comparison with Poisson distribution Blue bars denote a histogram of data divided into 1 sec bins. Red curve is a Poisson curve with rate = median count rate of data. |
 |
 |
| Quadrant-wise count rates Data is divided into 100 sec bins |
 |
|
| Module-wise count rates for Quadrant A Data is divided into 100 sec bins |
 |
 |
| Module-wise count rates for Quadrant B Data is divided into 100 sec bins |
 |
 |
| Module-wise count rates for Quadrant C Data is divided into 100 sec bins |
 |
 |
| Module-wise count rates for Quadrant D Data is divided into 100 sec bins |
 |
 |
| Parameter | Plot |
|---|---|
| CZT HV Monitor | 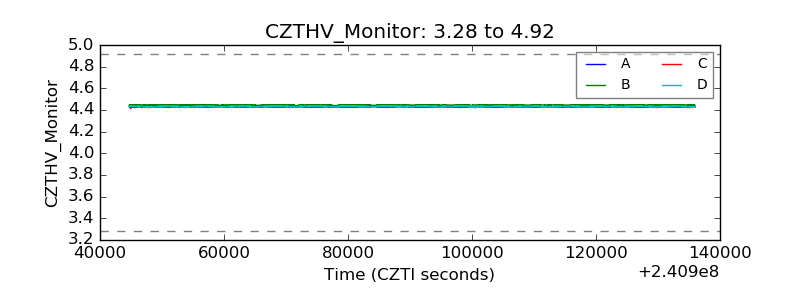 |
| D_VDD | 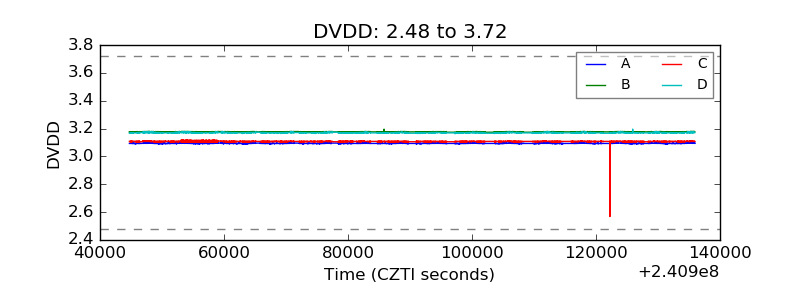 |
| Temperature 1 |  |
| Veto HV Monitor |  |
| Veto LLD |  |
| Alpha Counter |  |
| _CPM_Rate |  |
| CZT Counter |  |
| +2.5 Volts monitor | 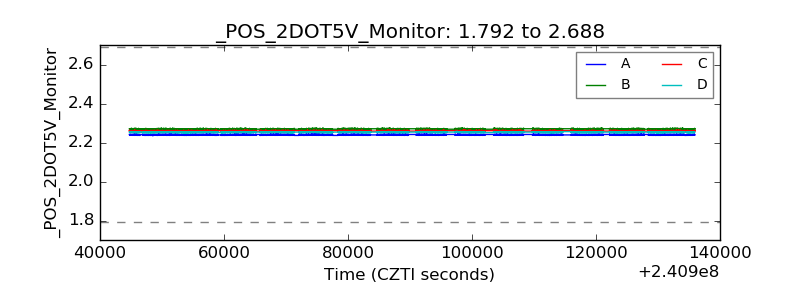 |
| +5 Volts monitor |  |
| _ROLL_ROT |  |
| _Roll_DEC |  |
| _Roll_RA |  |
| Veto Counter |  |