| Param | Original file | Final file |
|---|---|---|
| Filename | modeM0/AS1A03_095T03_9000001474cztM0_level2.evt | modeM0/AS1A03_095T03_9000001474cztM0_level2_quad_clean.evt |
| Size (bytes) | 2,274,672,960 | 397,929,600 |
| Size | 2.1 GB | 379.5 MB |
| Events in quadrant A | 14,728,408 | 2,518,239 |
| Events in quadrant B | 15,975,421 | 2,516,808 |
| Events in quadrant C | 13,909,593 | 2,523,069 |
| Events in quadrant D | 22,167,051 | 2,347,601 |
| Mode M9 | |||
|---|---|---|---|
| Quadrant | BADHDUFLAG | Total packets | Discarded packets |
| A | 0 | 24 | 0 |
| B | 0 | 24 | 0 |
| C | 0 | 24 | 0 |
| D | 0 | 25 | 0 |
| Mode M0 | |||
|---|---|---|---|
| Quadrant | BADHDUFLAG | Total packets | Discarded packets |
| A | 0 | 66762 | 0 |
| B | 0 | 69047 | 0 |
| C | 0 | 64861 | 0 |
| D | 0 | 87077 | 0 |
| Mode SS | |||
|---|---|---|---|
| Quadrant | BADHDUFLAG | Total packets | Discarded packets |
| A | 0 | 424 | 0 |
| B | 0 | 424 | 0 |
| C | 0 | 424 | 0 |
| D | 0 | 424 | 0 |
| Quadrant | Total seconds | Saturated seconds | Saturation percentage |
|---|---|---|---|
| A | 32042 | 144 | 0.449410% |
| B | 31949 | 336 | 1.051676% |
| C | 32042 | 49 | 0.152924% |
| D | 31835 | 917 | 2.880477% |
Noise dominated data is calculated using 1-second bins in cleaned event files. If a bin has >2000 counts, and if more than 50% of those come from <1% of pixels, then it is considered to be noise-dominated and hence unusable.
| Quadrant | # 1 sec bins | Bins with >0 counts | Bins with >2000 counts | High rate bins dominated by noise | Noise dominated (total time) | Noise dominated (detector-on time) | Marked lightcurve |
|---|---|---|---|---|---|---|---|
| A | 34666 | 32285 | 17 | 17 | 0.05% | 0.05% |  |
| B | 34666 | 32221 | 147 | 147 | 0.42% | 0.46% |  |
| C | 34665 | 32284 | 0 | 0 | 0.00% | 0.00% |  |
| D | 34666 | 32042 | 782 | 782 | 2.26% | 2.44% |  |
Top three noisy pixels from each quadrant. If the there are fewer than three noisy pixels in the level2.evt file, extra rows are filled as -1
| Pixel properties | Quadrant properties | ||||||
|---|---|---|---|---|---|---|---|
| Quadrant | DetID | PixID | Counts | Sigma | Mean | Median | Sigma |
| A | 8 | 15 | 452693 | 604.34 | 3671 | 3594 | 743.1 |
| A | 15 | 174 | 111444 | 145.13 | 3671 | 3594 | 743.1 |
| A | 0 | 226 | 33467 | 40.2 | 3671 | 3594 | 743.1 |
| B | 4 | 239 | 535149 | 768.93 | 3669 | 3581 | 691.3 |
| B | 0 | 214 | 275285 | 393.03 | 3669 | 3581 | 691.3 |
| B | 11 | 51 | 253352 | 361.3 | 3669 | 3581 | 691.3 |
| C | 13 | 61 | 27035 | 28.67 | 3553 | 3565 | 818.5 |
| C | 0 | 207 | 21695 | 22.15 | 3553 | 3565 | 818.5 |
| C | 14 | 67 | 18215 | 17.9 | 3553 | 3565 | 818.5 |
| D | 1 | 52 | 5495232 | 6597.24 | 3477 | 3380 | 832.4 |
| D | 8 | 195 | 1940516 | 2327.04 | 3477 | 3380 | 832.4 |
| D | 13 | 104 | 314452 | 373.68 | 3477 | 3380 | 832.4 |
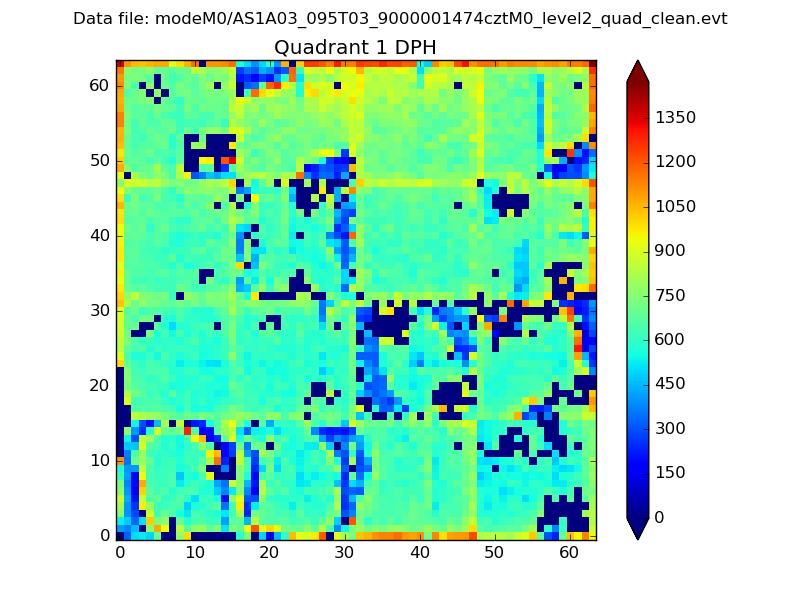
Histogram calculated using DETX and DETY for each event in the final _common_clean file
| Quadrant A |  |
 |
Quadrant B |
|---|---|---|---|
| Quadrant D | 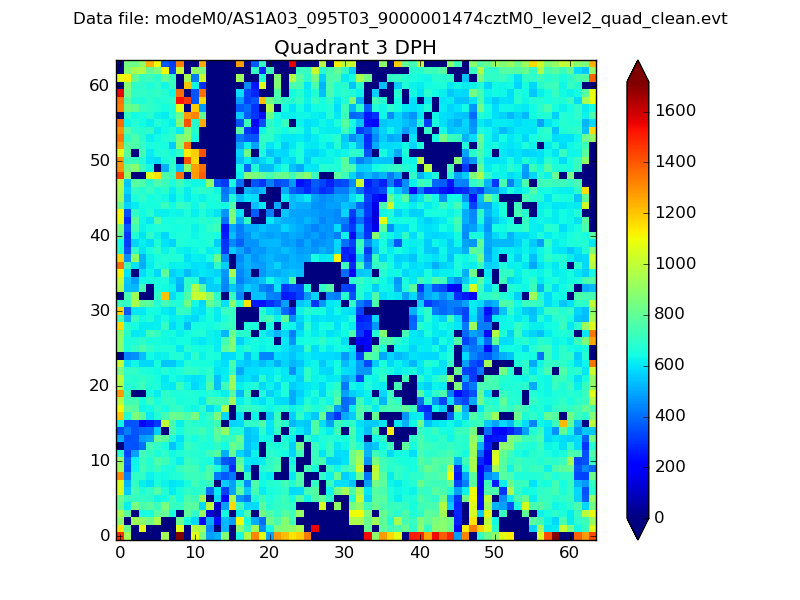 |
 |
Quadrant C |
| Plot type | Count rate plots | Images |
|---|---|---|
| Comparison with Poisson distribution Blue bars denote a histogram of data divided into 1 sec bins. Red curve is a Poisson curve with rate = median count rate of data. |
 |
 |
| Quadrant-wise count rates Data is divided into 100 sec bins |
 |
|
| Module-wise count rates for Quadrant A Data is divided into 100 sec bins |
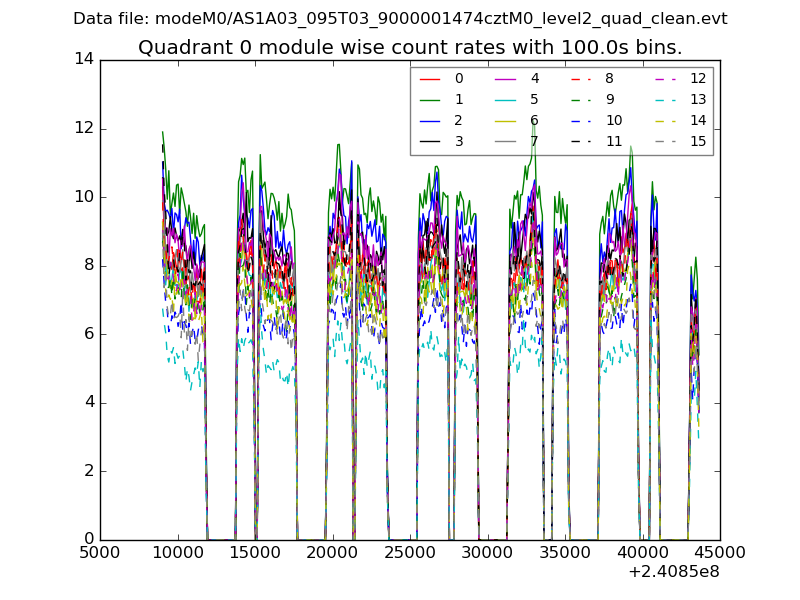 |
 |
| Module-wise count rates for Quadrant B Data is divided into 100 sec bins |
 |
 |
| Module-wise count rates for Quadrant C Data is divided into 100 sec bins |
 |
 |
| Module-wise count rates for Quadrant D Data is divided into 100 sec bins |
 |
 |
| Parameter | Plot |
|---|---|
| CZT HV Monitor |  |
| D_VDD |  |
| Temperature 1 | 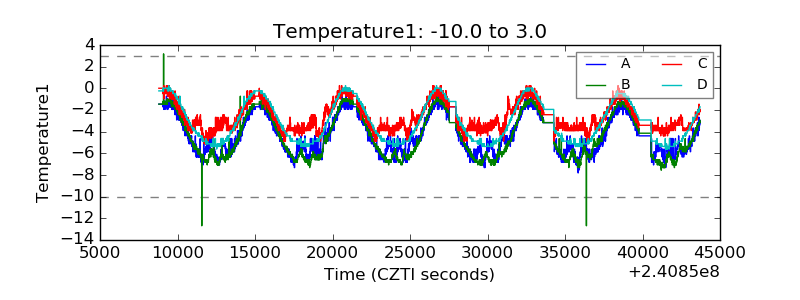 |
| Veto HV Monitor | 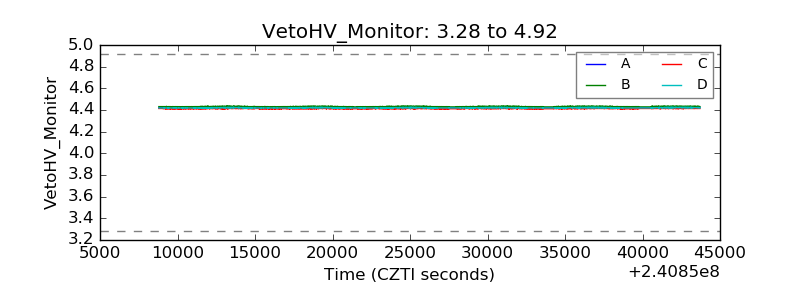 |
| Veto LLD |  |
| Alpha Counter |  |
| _CPM_Rate |  |
| CZT Counter |  |
| +2.5 Volts monitor |  |
| +5 Volts monitor |  |
| _ROLL_ROT |  |
| _Roll_DEC |  |
| _Roll_RA | 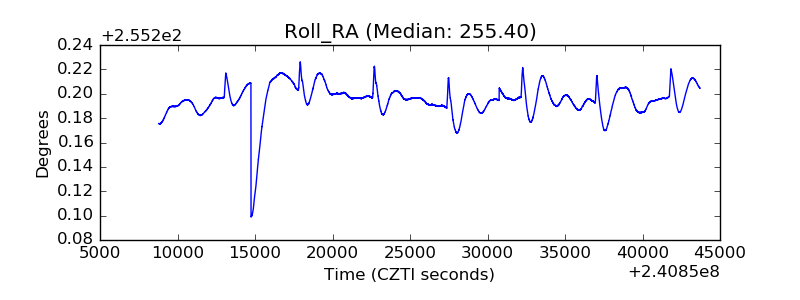 |
| Veto Counter |  |