| Param | Original file | Final file |
|---|---|---|
| Filename | modeM0/AS1G07_011T04_9000001466cztM0_level2.evt | modeM0/AS1G07_011T04_9000001466cztM0_level2_quad_clean.evt |
| Size (bytes) | 1,009,543,680 | 192,695,040 |
| Size | 962.8 MB | 183.8 MB |
| Events in quadrant A | 7,168,943 | 1,235,364 |
| Events in quadrant B | 7,194,809 | 1,211,283 |
| Events in quadrant C | 7,210,202 | 1,216,853 |
| Events in quadrant D | 8,024,690 | 1,177,584 |
| Mode M0 | |||
|---|---|---|---|
| Quadrant | BADHDUFLAG | Total packets | Discarded packets |
| A | 0 | 30111 | 0 |
| B | 0 | 29652 | 0 |
| C | 0 | 30106 | 0 |
| D | 0 | 32854 | 0 |
| Mode SS | |||
|---|---|---|---|
| Quadrant | BADHDUFLAG | Total packets | Discarded packets |
| A | 0 | 309 | 0 |
| B | 0 | 305 | 0 |
| C | 0 | 308 | 0 |
| D | 0 | 308 | 0 |
| Mode M9 | |||
|---|---|---|---|
| Quadrant | BADHDUFLAG | Total packets | Discarded packets |
| A | 0 | 37 | 0 |
| B | 0 | 37 | 0 |
| C | 0 | 37 | 0 |
| D | 0 | 37 | 0 |
| Quadrant | Total seconds | Saturated seconds | Saturation percentage |
|---|---|---|---|
| A | 14427 | 141 | 0.977334% |
| B | 14028 | 159 | 1.133447% |
| C | 14509 | 98 | 0.675443% |
| D | 14535 | 131 | 0.901273% |
Noise dominated data is calculated using 1-second bins in cleaned event files. If a bin has >2000 counts, and if more than 50% of those come from <1% of pixels, then it is considered to be noise-dominated and hence unusable.
| Quadrant | # 1 sec bins | Bins with >0 counts | Bins with >2000 counts | High rate bins dominated by noise | Noise dominated (total time) | Noise dominated (detector-on time) | Marked lightcurve |
|---|---|---|---|---|---|---|---|
| A | 19051 | 14886 | 0 | 0 | 0.00% | 0.00% |  |
| B | 19051 | 14514 | 5 | 5 | 0.03% | 0.03% |  |
| C | 19051 | 14956 | 2 | 2 | 0.01% | 0.01% |  |
| D | 19051 | 14805 | 26 | 26 | 0.14% | 0.18% |  |
Top three noisy pixels from each quadrant. If the there are fewer than three noisy pixels in the level2.evt file, extra rows are filled as -1
| Pixel properties | Quadrant properties | ||||||
|---|---|---|---|---|---|---|---|
| Quadrant | DetID | PixID | Counts | Sigma | Mean | Median | Sigma |
| A | 0 | 226 | 16720 | 40.17 | 1858 | 1826 | 370.8 |
| A | 13 | 253 | 16496 | 39.57 | 1858 | 1826 | 370.8 |
| A | 12 | 194 | 15030 | 35.61 | 1858 | 1826 | 370.8 |
| B | 0 | 219 | 53799 | 153.22 | 1817 | 1778 | 339.5 |
| B | 0 | 214 | 50190 | 142.59 | 1817 | 1778 | 339.5 |
| B | 12 | 111 | 37577 | 105.44 | 1817 | 1778 | 339.5 |
| C | 14 | 67 | 50943 | 117.62 | 1825 | 1843 | 417.4 |
| C | 14 | 234 | 44483 | 102.15 | 1825 | 1843 | 417.4 |
| C | 13 | 61 | 13552 | 28.05 | 1825 | 1843 | 417.4 |
| D | 8 | 195 | 390285 | 902.72 | 1822 | 1779 | 430.4 |
| D | 1 | 52 | 304545 | 703.5 | 1822 | 1779 | 430.4 |
| D | 4 | 95 | 163705 | 376.24 | 1822 | 1779 | 430.4 |
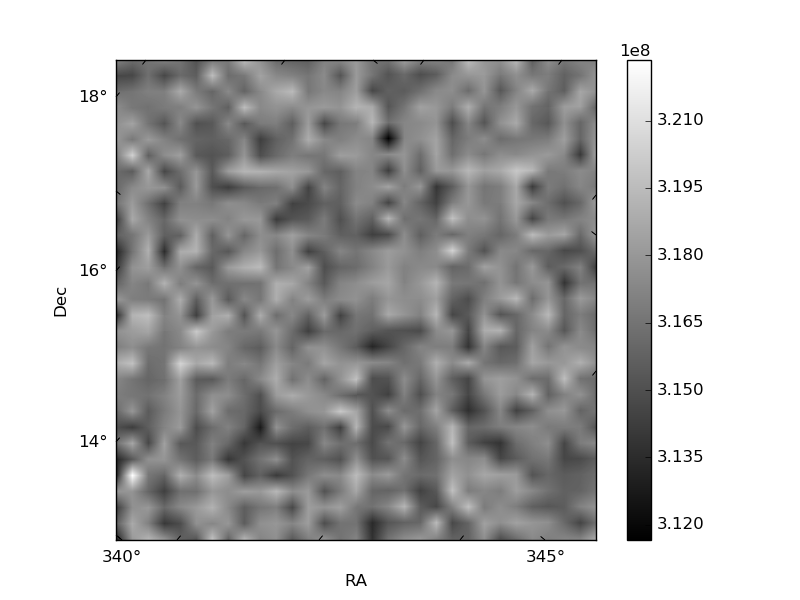
Histogram calculated using DETX and DETY for each event in the final _common_clean file
| Quadrant A |  |
 |
Quadrant B |
|---|---|---|---|
| Quadrant D |  |
 |
Quadrant C |
| Plot type | Count rate plots | Images |
|---|---|---|
| Comparison with Poisson distribution Blue bars denote a histogram of data divided into 1 sec bins. Red curve is a Poisson curve with rate = median count rate of data. |
 |
 |
| Quadrant-wise count rates Data is divided into 100 sec bins |
 |
|
| Module-wise count rates for Quadrant A Data is divided into 100 sec bins |
 |
 |
| Module-wise count rates for Quadrant B Data is divided into 100 sec bins |
 |
 |
| Module-wise count rates for Quadrant C Data is divided into 100 sec bins |
 |
 |
| Module-wise count rates for Quadrant D Data is divided into 100 sec bins |
 |
 |
| Parameter | Plot |
|---|---|
| CZT HV Monitor |  |
| D_VDD |  |
| Temperature 1 | 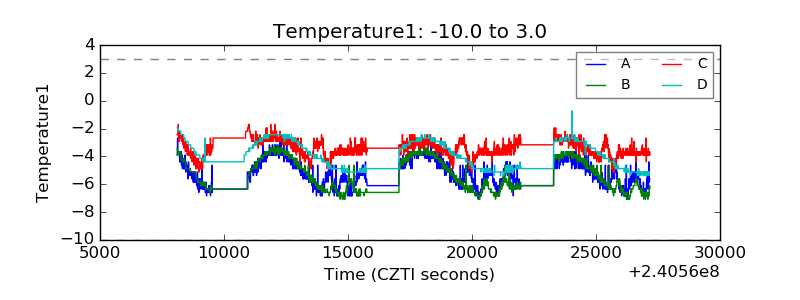 |
| Veto HV Monitor |  |
| Veto LLD | 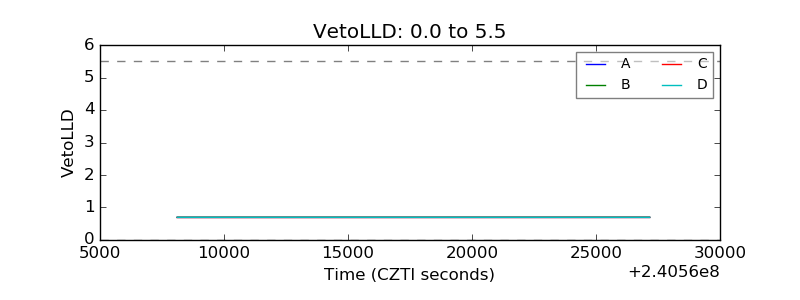 |
| Alpha Counter |  |
| _CPM_Rate |  |
| CZT Counter |  |
| +2.5 Volts monitor |  |
| +5 Volts monitor | 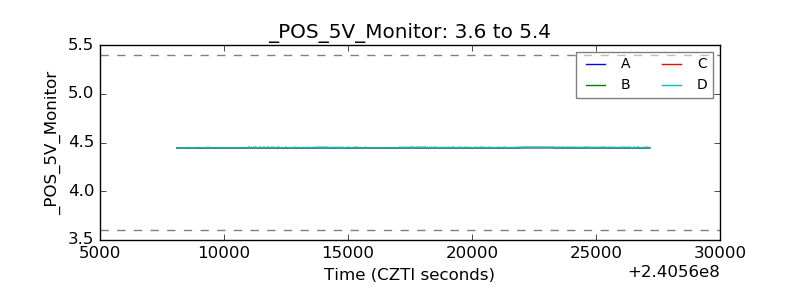 |
| _ROLL_ROT |  |
| _Roll_DEC |  |
| _Roll_RA |  |
| Veto Counter |  |