| Param | Original file | Final file |
|---|---|---|
| Filename | modeM0/AS1A03_050T01_9000001468cztM0_level2.evt | modeM0/AS1A03_050T01_9000001468cztM0_level2_quad_clean.evt |
| Size (bytes) | 5,641,416,000 | 1,291,726,080 |
| Size | 5.3 GB | 1.2 GB |
| Events in quadrant A | 37,544,309 | 8,479,154 |
| Events in quadrant B | 39,669,577 | 8,572,640 |
| Events in quadrant C | 34,975,187 | 8,605,194 |
| Events in quadrant D | 53,397,841 | 8,118,388 |
| Mode SS | |||
|---|---|---|---|
| Quadrant | BADHDUFLAG | Total packets | Discarded packets |
| A | 0 | 1592 | 0 |
| B | 0 | 1592 | 0 |
| C | 0 | 1592 | 0 |
| D | 0 | 1592 | 0 |
| Mode M9 | |||
|---|---|---|---|
| Quadrant | BADHDUFLAG | Total packets | Discarded packets |
| A | 0 | 129 | 0 |
| B | 0 | 129 | 0 |
| C | 0 | 129 | 0 |
| D | 0 | 129 | 0 |
| Mode M0 | |||
|---|---|---|---|
| Quadrant | BADHDUFLAG | Total packets | Discarded packets |
| A | 0 | 165724 | 0 |
| B | 0 | 169427 | 0 |
| C | 0 | 159677 | 0 |
| D | 0 | 209869 | 0 |
| Quadrant | Total seconds | Saturated seconds | Saturation percentage |
|---|---|---|---|
| A | 78076 | 1198 | 1.534402% |
| B | 78074 | 1036 | 1.326946% |
| C | 78076 | 445 | 0.569957% |
| D | 78076 | 2461 | 3.152057% |
Noise dominated data is calculated using 1-second bins in cleaned event files. If a bin has >2000 counts, and if more than 50% of those come from <1% of pixels, then it is considered to be noise-dominated and hence unusable.
| Quadrant | # 1 sec bins | Bins with >0 counts | Bins with >2000 counts | High rate bins dominated by noise | Noise dominated (total time) | Noise dominated (detector-on time) | Marked lightcurve |
|---|---|---|---|---|---|---|---|
| A | 90316 | 78085 | 394 | 394 | 0.44% | 0.50% |  |
| B | 90316 | 78086 | 135 | 135 | 0.15% | 0.17% | 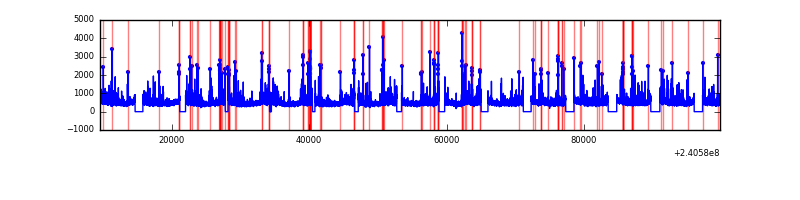 |
| C | 90316 | 78087 | 6 | 6 | 0.01% | 0.01% |  |
| D | 90316 | 78087 | 1756 | 1756 | 1.94% | 2.25% | 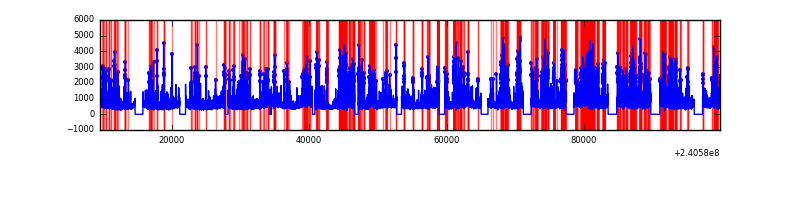 |
Top three noisy pixels from each quadrant. If the there are fewer than three noisy pixels in the level2.evt file, extra rows are filled as -1
| Pixel properties | Quadrant properties | ||||||
|---|---|---|---|---|---|---|---|
| Quadrant | DetID | PixID | Counts | Sigma | Mean | Median | Sigma |
| A | 15 | 223 | 1113276 | 603.94 | 9145 | 8960 | 1828.5 |
| A | 15 | 239 | 402376 | 215.16 | 9145 | 8960 | 1828.5 |
| A | 8 | 15 | 366536 | 195.56 | 9145 | 8960 | 1828.5 |
| B | 11 | 51 | 1005172 | 584.09 | 9179 | 8962 | 1705.6 |
| B | 5 | 255 | 758556 | 439.49 | 9179 | 8962 | 1705.6 |
| B | 4 | 239 | 749111 | 433.96 | 9179 | 8962 | 1705.6 |
| C | 14 | 67 | 139823 | 65.05 | 8894 | 8934 | 2012.2 |
| C | 13 | 61 | 66469 | 28.59 | 8894 | 8934 | 2012.2 |
| C | 4 | 175 | 56108 | 23.44 | 8894 | 8934 | 2012.2 |
| D | 1 | 52 | 6753969 | 3259.01 | 8796 | 8561 | 2069.8 |
| D | 8 | 195 | 4983485 | 2403.61 | 8796 | 8561 | 2069.8 |
| D | 2 | 16 | 1848195 | 888.81 | 8796 | 8561 | 2069.8 |
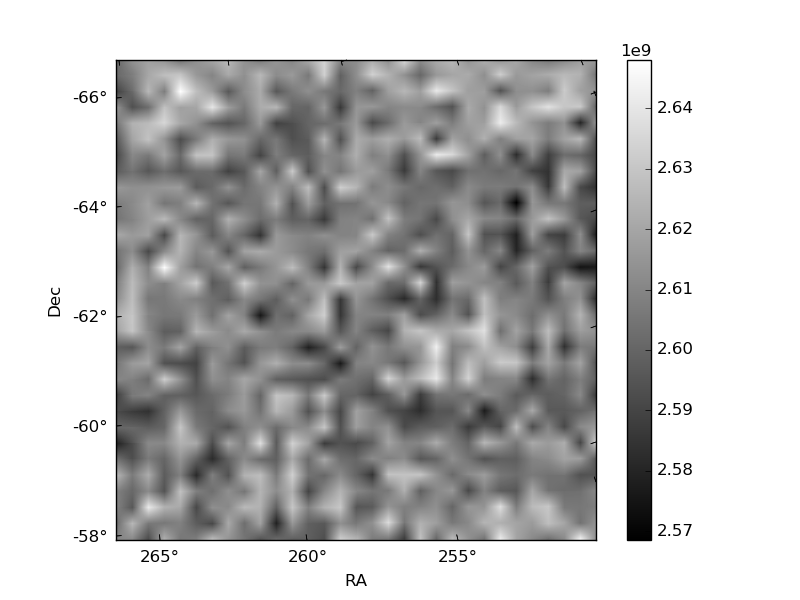
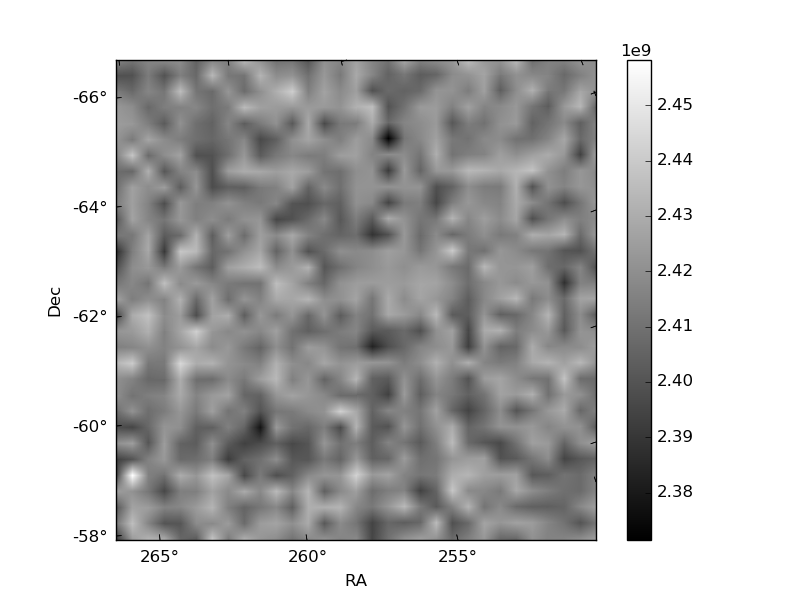
Histogram calculated using DETX and DETY for each event in the final _common_clean file
| Quadrant A |  |
 |
Quadrant B |
|---|---|---|---|
| Quadrant D |  |
 |
Quadrant C |
| Plot type | Count rate plots | Images |
|---|---|---|
| Comparison with Poisson distribution Blue bars denote a histogram of data divided into 1 sec bins. Red curve is a Poisson curve with rate = median count rate of data. |
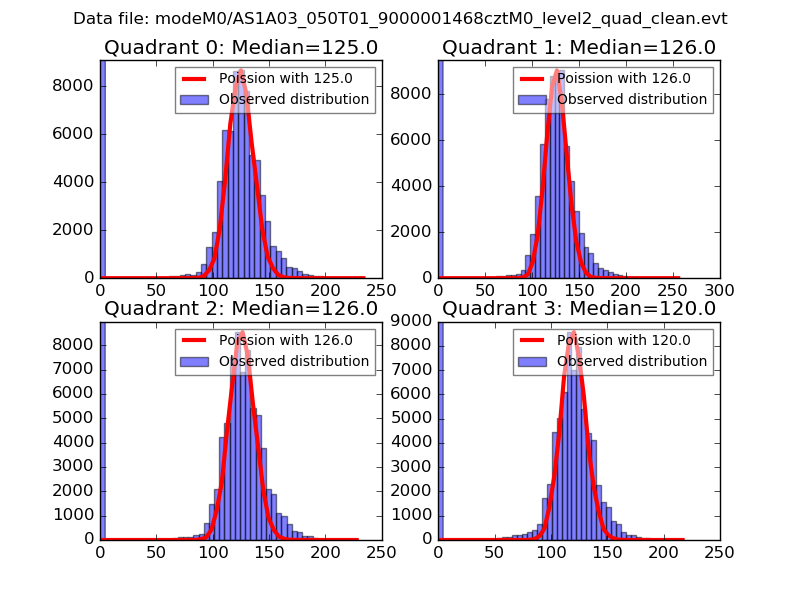 |
 |
| Quadrant-wise count rates Data is divided into 100 sec bins |
 |
|
| Module-wise count rates for Quadrant A Data is divided into 100 sec bins |
 |
 |
| Module-wise count rates for Quadrant B Data is divided into 100 sec bins |
 |
 |
| Module-wise count rates for Quadrant C Data is divided into 100 sec bins |
 |
 |
| Module-wise count rates for Quadrant D Data is divided into 100 sec bins |
 |
 |
| Parameter | Plot |
|---|---|
| CZT HV Monitor |  |
| D_VDD |  |
| Temperature 1 |  |
| Veto HV Monitor | 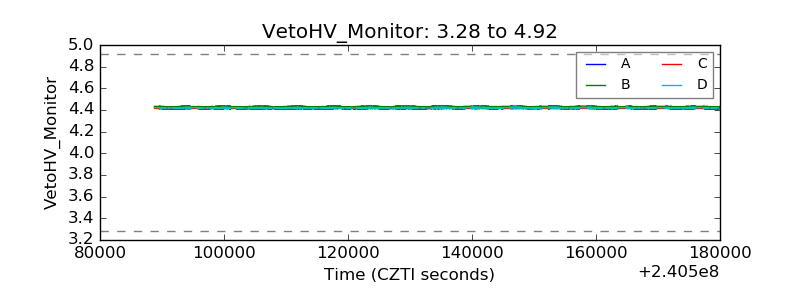 |
| Veto LLD |  |
| Alpha Counter |  |
| _CPM_Rate |  |
| CZT Counter |  |
| +2.5 Volts monitor |  |
| +5 Volts monitor |  |
| _ROLL_ROT |  |
| _Roll_DEC |  |
| _Roll_RA |  |
| Veto Counter |  |