| Param | Original file | Final file |
|---|---|---|
| Filename | modeM0/AS1A03_133T01_9000001464cztM0_level2.evt | modeM0/AS1A03_133T01_9000001464cztM0_level2_quad_clean.evt |
| Size (bytes) | 6,564,908,160 | 1,213,130,880 |
| Size | 6.1 GB | 1.1 GB |
| Events in quadrant A | 43,446,630 | 7,771,543 |
| Events in quadrant B | 46,345,361 | 7,779,204 |
| Events in quadrant C | 40,724,988 | 7,721,962 |
| Events in quadrant D | 62,206,099 | 7,273,540 |
| Mode M0 | |||
|---|---|---|---|
| Quadrant | BADHDUFLAG | Total packets | Discarded packets |
| A | 0 | 190284 | 0 |
| B | 0 | 197423 | 0 |
| C | 0 | 185206 | 0 |
| D | 0 | 244289 | 0 |
| Mode M9 | |||
|---|---|---|---|
| Quadrant | BADHDUFLAG | Total packets | Discarded packets |
| A | 0 | 132 | 0 |
| B | 0 | 132 | 0 |
| C | 0 | 132 | 0 |
| D | 0 | 133 | 0 |
| Mode SS | |||
|---|---|---|---|
| Quadrant | BADHDUFLAG | Total packets | Discarded packets |
| A | 0 | 1836 | 0 |
| B | 0 | 1834 | 0 |
| C | 0 | 1834 | 0 |
| D | 0 | 1836 | 0 |
| Quadrant | Total seconds | Saturated seconds | Saturation percentage |
|---|---|---|---|
| A | 90479 | 884 | 0.977022% |
| B | 90457 | 1055 | 1.166300% |
| C | 90477 | 471 | 0.520574% |
| D | 90477 | 2179 | 2.408347% |
Noise dominated data is calculated using 1-second bins in cleaned event files. If a bin has >2000 counts, and if more than 50% of those come from <1% of pixels, then it is considered to be noise-dominated and hence unusable.
| Quadrant | # 1 sec bins | Bins with >0 counts | Bins with >2000 counts | High rate bins dominated by noise | Noise dominated (total time) | Noise dominated (detector-on time) | Marked lightcurve |
|---|---|---|---|---|---|---|---|
| A | 125734 | 90587 | 163 | 163 | 0.13% | 0.18% |  |
| B | 125734 | 90590 | 152 | 152 | 0.12% | 0.17% |  |
| C | 125734 | 90591 | 7 | 7 | 0.01% | 0.01% |  |
| D | 125734 | 90579 | 1490 | 1490 | 1.19% | 1.64% |  |
Top three noisy pixels from each quadrant. If the there are fewer than three noisy pixels in the level2.evt file, extra rows are filled as -1
| Pixel properties | Quadrant properties | ||||||
|---|---|---|---|---|---|---|---|
| Quadrant | DetID | PixID | Counts | Sigma | Mean | Median | Sigma |
| A | 15 | 223 | 595609 | 269.62 | 10768 | 10559 | 2169.9 |
| A | 15 | 174 | 580648 | 262.72 | 10768 | 10559 | 2169.9 |
| A | 8 | 15 | 355570 | 159.0 | 10768 | 10559 | 2169.9 |
| B | 4 | 239 | 992472 | 485.19 | 10775 | 10546 | 2023.8 |
| B | 0 | 214 | 783175 | 381.77 | 10775 | 10546 | 2023.8 |
| B | 0 | 219 | 595334 | 288.96 | 10775 | 10546 | 2023.8 |
| C | 14 | 67 | 121476 | 46.6 | 10387 | 10457 | 2382.5 |
| C | 13 | 61 | 78397 | 28.52 | 10387 | 10457 | 2382.5 |
| C | 14 | 234 | 57364 | 19.69 | 10387 | 10457 | 2382.5 |
| D | 1 | 52 | 11706594 | 4775.3 | 10270 | 9997 | 2449.4 |
| D | 8 | 195 | 4861684 | 1980.77 | 10270 | 9997 | 2449.4 |
| D | 7 | 71 | 1420658 | 575.92 | 10270 | 9997 | 2449.4 |
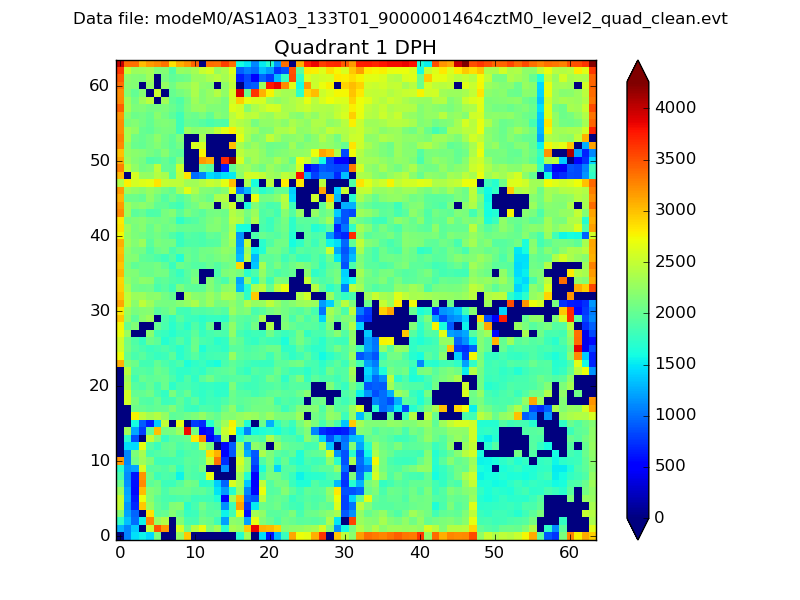
Histogram calculated using DETX and DETY for each event in the final _common_clean file
| Quadrant A |  |
 |
Quadrant B |
|---|---|---|---|
| Quadrant D | 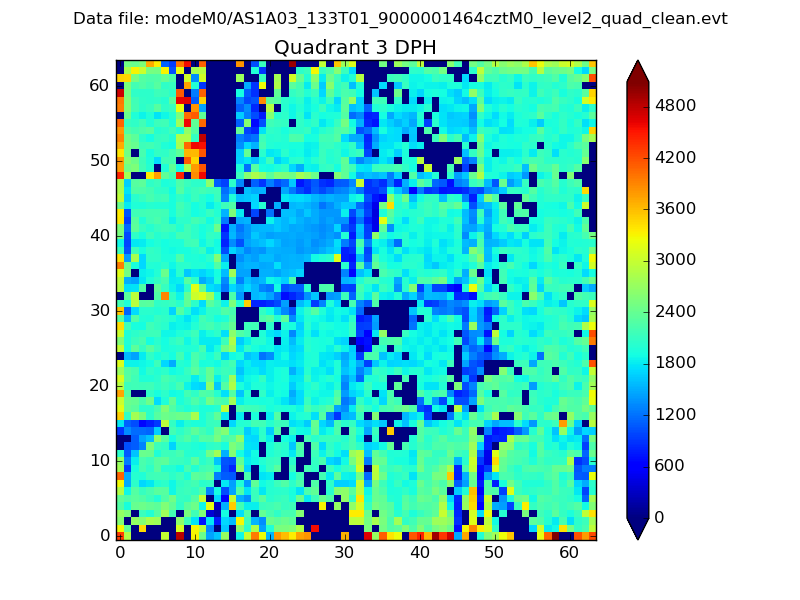 |
 |
Quadrant C |
| Plot type | Count rate plots | Images |
|---|---|---|
| Comparison with Poisson distribution Blue bars denote a histogram of data divided into 1 sec bins. Red curve is a Poisson curve with rate = median count rate of data. |
 |
 |
| Quadrant-wise count rates Data is divided into 100 sec bins |
 |
|
| Module-wise count rates for Quadrant A Data is divided into 100 sec bins |
 |
 |
| Module-wise count rates for Quadrant B Data is divided into 100 sec bins |
 |
 |
| Module-wise count rates for Quadrant C Data is divided into 100 sec bins |
 |
 |
| Module-wise count rates for Quadrant D Data is divided into 100 sec bins |
 |
 |
| Parameter | Plot |
|---|---|
| CZT HV Monitor | 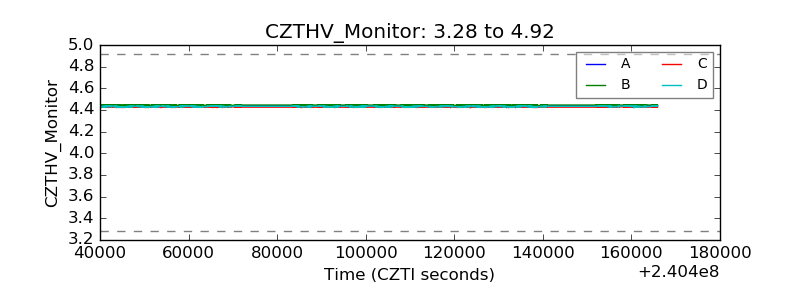 |
| D_VDD | 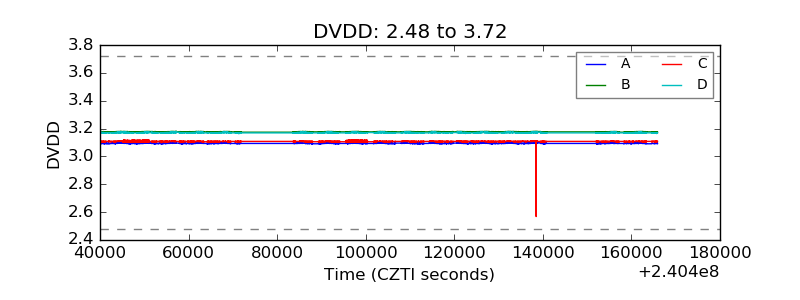 |
| Temperature 1 |  |
| Veto HV Monitor |  |
| Veto LLD |  |
| Alpha Counter |  |
| _CPM_Rate |  |
| CZT Counter |  |
| +2.5 Volts monitor |  |
| +5 Volts monitor |  |
| _ROLL_ROT |  |
| _Roll_DEC |  |
| _Roll_RA | 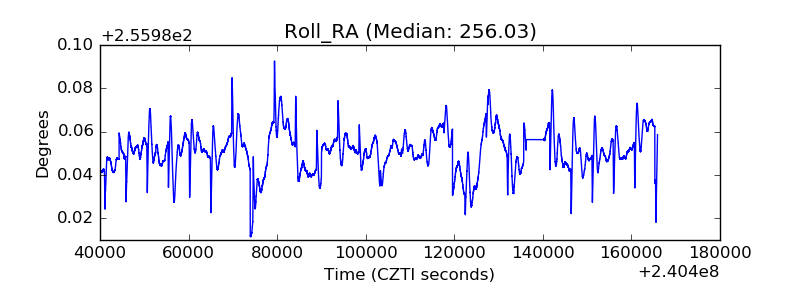 |
| Veto Counter | 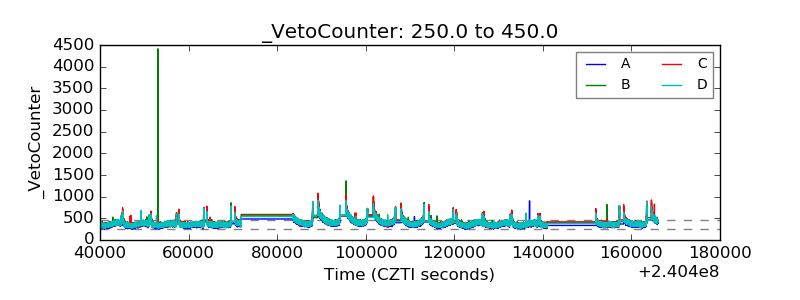 |