| Param | Original file | Final file |
|---|---|---|
| Filename | modeM0/AS1A03_039T01_9000001462cztM0_level2.evt | modeM0/AS1A03_039T01_9000001462cztM0_level2_quad_clean.evt |
| Size (bytes) | 6,754,412,160 | 933,753,600 |
| Size | 6.3 GB | 890.5 MB |
| Events in quadrant A | 35,137,644 | 6,176,406 |
| Events in quadrant B | 36,349,491 | 6,249,040 |
| Events in quadrant C | 31,352,374 | 6,250,001 |
| Events in quadrant D | 97,013,563 | 4,807,432 |
| Mode M9 | |||
|---|---|---|---|
| Quadrant | BADHDUFLAG | Total packets | Discarded packets |
| A | 0 | 117 | 0 |
| B | 0 | 117 | 0 |
| C | 0 | 117 | 0 |
| D | 0 | 117 | 0 |
| Mode SS | |||
|---|---|---|---|
| Quadrant | BADHDUFLAG | Total packets | Discarded packets |
| A | 0 | 1418 | 0 |
| B | 0 | 1418 | 0 |
| C | 0 | 1420 | 0 |
| D | 0 | 1420 | 0 |
| Mode M0 | |||
|---|---|---|---|
| Quadrant | BADHDUFLAG | Total packets | Discarded packets |
| A | 0 | 152098 | 0 |
| B | 0 | 154540 | 0 |
| C | 0 | 143424 | 0 |
| D | 0 | 334723 | 0 |
| Quadrant | Total seconds | Saturated seconds | Saturation percentage |
|---|---|---|---|
| A | 69931 | 1355 | 1.937624% |
| B | 69938 | 1037 | 1.482742% |
| C | 69938 | 483 | 0.690612% |
| D | 69844 | 26376 | 37.764160% |
Noise dominated data is calculated using 1-second bins in cleaned event files. If a bin has >2000 counts, and if more than 50% of those come from <1% of pixels, then it is considered to be noise-dominated and hence unusable.
| Quadrant | # 1 sec bins | Bins with >0 counts | Bins with >2000 counts | High rate bins dominated by noise | Noise dominated (total time) | Noise dominated (detector-on time) | Marked lightcurve |
|---|---|---|---|---|---|---|---|
| A | 81393 | 69993 | 599 | 599 | 0.74% | 0.86% |  |
| B | 81393 | 69996 | 194 | 194 | 0.24% | 0.28% |  |
| C | 81393 | 69995 | 2 | 2 | 0.00% | 0.00% | 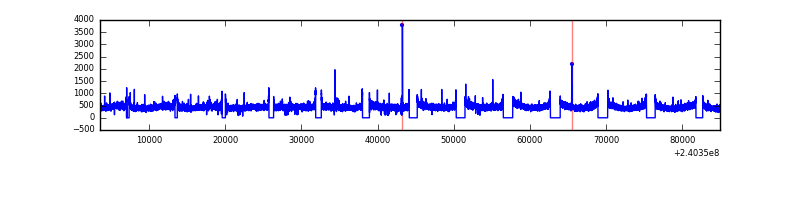 |
| D | 81393 | 69906 | 25381 | 25381 | 31.18% | 36.31% |  |
Top three noisy pixels from each quadrant. If the there are fewer than three noisy pixels in the level2.evt file, extra rows are filled as -1
| Pixel properties | Quadrant properties | ||||||
|---|---|---|---|---|---|---|---|
| Quadrant | DetID | PixID | Counts | Sigma | Mean | Median | Sigma |
| A | 15 | 223 | 1595611 | 962.47 | 8242 | 8089 | 1649.4 |
| A | 15 | 239 | 876611 | 526.56 | 8242 | 8089 | 1649.4 |
| A | 8 | 15 | 455445 | 271.22 | 8242 | 8089 | 1649.4 |
| B | 4 | 239 | 1299566 | 834.82 | 8278 | 8091 | 1547.0 |
| B | 4 | 81 | 1106174 | 709.81 | 8278 | 8091 | 1547.0 |
| B | 0 | 219 | 615122 | 392.39 | 8278 | 8091 | 1547.0 |
| C | 14 | 67 | 129732 | 66.58 | 7991 | 8026 | 1828.0 |
| C | 13 | 61 | 60457 | 28.68 | 7991 | 8026 | 1828.0 |
| C | 14 | 234 | 46431 | 21.01 | 7991 | 8026 | 1828.0 |
| D | 1 | 52 | 61241267 | 39325.7 | 6561 | 6370 | 1557.1 |
| D | 8 | 195 | 3960974 | 2539.69 | 6561 | 6370 | 1557.1 |
| D | 2 | 16 | 1874329 | 1199.62 | 6561 | 6370 | 1557.1 |
Histogram calculated using DETX and DETY for each event in the final _common_clean file
| Quadrant A |  |
 |
Quadrant B |
|---|---|---|---|
| Quadrant D | 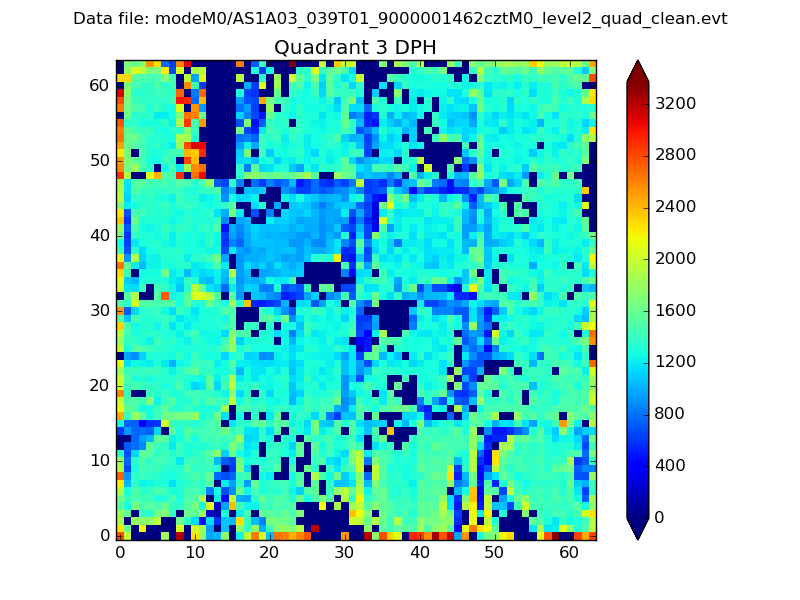 |
 |
Quadrant C |
| Plot type | Count rate plots | Images |
|---|---|---|
| Comparison with Poisson distribution Blue bars denote a histogram of data divided into 1 sec bins. Red curve is a Poisson curve with rate = median count rate of data. |
 |
 |
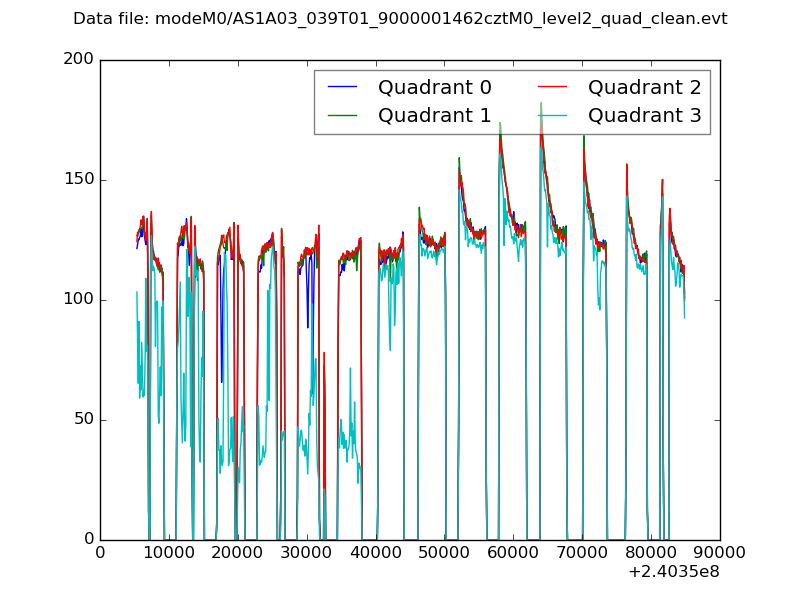
| Quadrant-wise count rates Data is divided into 100 sec bins |
 |
|
| Module-wise count rates for Quadrant A Data is divided into 100 sec bins |
 |
 |
| Module-wise count rates for Quadrant B Data is divided into 100 sec bins |
 |
 |
| Module-wise count rates for Quadrant C Data is divided into 100 sec bins |
 |
 |
| Module-wise count rates for Quadrant D Data is divided into 100 sec bins |
 |
 |
| Parameter | Plot |
|---|---|
| CZT HV Monitor |  |
| D_VDD |  |
| Temperature 1 |  |
| Veto HV Monitor | 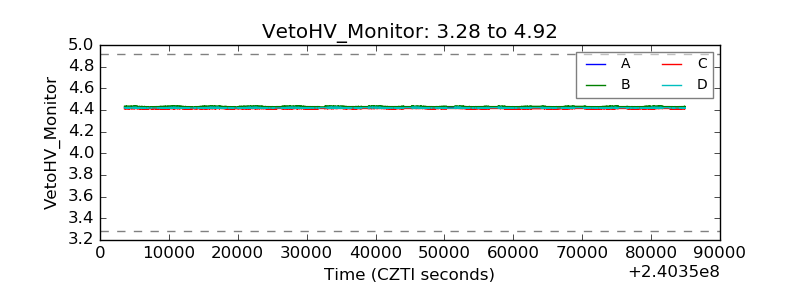 |
| Veto LLD |  |
| Alpha Counter |  |
| _CPM_Rate |  |
| CZT Counter |  |
| +2.5 Volts monitor |  |
| +5 Volts monitor |  |
| _ROLL_ROT |  |
| _Roll_DEC | 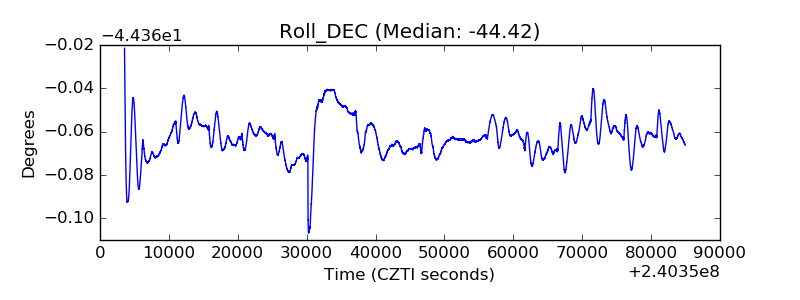 |
| _Roll_RA |  |
| Veto Counter |  |