| Param | Original file | Final file |
|---|---|---|
| Filename | modeM0/AS1A03_116T01_9000001460cztM0_level2.evt | modeM0/AS1A03_116T01_9000001460cztM0_level2_quad_clean.evt |
| Size (bytes) | 7,524,037,440 | 1,256,650,560 |
| Size | 7.0 GB | 1.2 GB |
| Events in quadrant A | 45,521,729 | 8,135,521 |
| Events in quadrant B | 50,244,380 | 8,179,473 |
| Events in quadrant C | 42,897,779 | 8,061,570 |
| Events in quadrant D | 82,861,878 | 7,232,515 |
| Mode SS | |||
|---|---|---|---|
| Quadrant | BADHDUFLAG | Total packets | Discarded packets |
| A | 0 | 1920 | 0 |
| B | 0 | 1922 | 0 |
| C | 0 | 1922 | 0 |
| D | 0 | 1922 | 0 |
| Mode M9 | |||
|---|---|---|---|
| Quadrant | BADHDUFLAG | Total packets | Discarded packets |
| A | 0 | 165 | 0 |
| B | 0 | 165 | 0 |
| C | 0 | 165 | 0 |
| D | 0 | 165 | 0 |
| Mode M0 | |||
|---|---|---|---|
| Quadrant | BADHDUFLAG | Total packets | Discarded packets |
| A | 0 | 198954 | 0 |
| B | 0 | 211523 | 0 |
| C | 0 | 193681 | 0 |
| D | 0 | 308804 | 0 |
| Quadrant | Total seconds | Saturated seconds | Saturation percentage |
|---|---|---|---|
| A | 94132 | 1252 | 1.330047% |
| B | 94121 | 1394 | 1.481072% |
| C | 94144 | 661 | 0.702116% |
| D | 94121 | 10993 | 11.679646% |
Noise dominated data is calculated using 1-second bins in cleaned event files. If a bin has >2000 counts, and if more than 50% of those come from <1% of pixels, then it is considered to be noise-dominated and hence unusable.
| Quadrant | # 1 sec bins | Bins with >0 counts | Bins with >2000 counts | High rate bins dominated by noise | Noise dominated (total time) | Noise dominated (detector-on time) | Marked lightcurve |
|---|---|---|---|---|---|---|---|
| A | 110842 | 94176 | 238 | 238 | 0.21% | 0.25% | 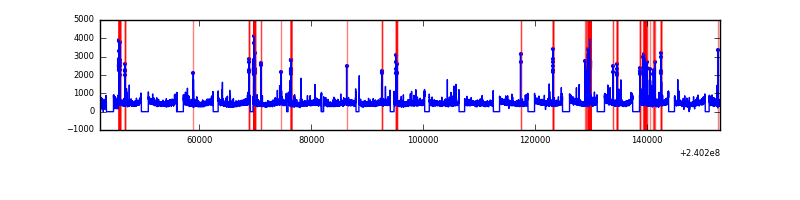 |
| B | 110842 | 94176 | 295 | 295 | 0.27% | 0.31% | 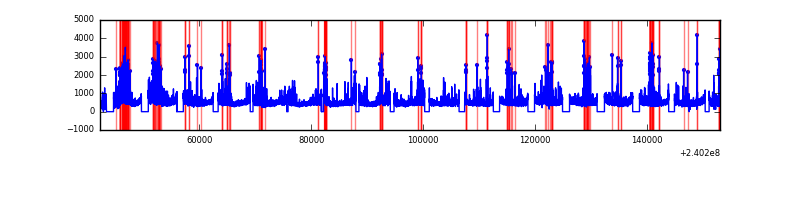 |
| C | 110842 | 94181 | 10 | 10 | 0.01% | 0.01% |  |
| D | 110841 | 94167 | 9560 | 9560 | 8.62% | 10.15% |  |
Top three noisy pixels from each quadrant. If the there are fewer than three noisy pixels in the level2.evt file, extra rows are filled as -1
| Pixel properties | Quadrant properties | ||||||
|---|---|---|---|---|---|---|---|
| Quadrant | DetID | PixID | Counts | Sigma | Mean | Median | Sigma |
| A | 15 | 174 | 705359 | 305.05 | 11353 | 11140 | 2275.8 |
| A | 15 | 223 | 452572 | 193.97 | 11353 | 11140 | 2275.8 |
| A | 15 | 239 | 214528 | 89.37 | 11353 | 11140 | 2275.8 |
| B | 4 | 81 | 2875279 | 1338.09 | 11383 | 11135 | 2140.5 |
| B | 4 | 239 | 819437 | 377.63 | 11383 | 11135 | 2140.5 |
| B | 0 | 214 | 774973 | 356.85 | 11383 | 11135 | 2140.5 |
| C | 14 | 67 | 122739 | 44.37 | 10950 | 11013 | 2518.0 |
| C | 13 | 61 | 82804 | 28.51 | 10950 | 11013 | 2518.0 |
| C | 14 | 234 | 80139 | 27.45 | 10950 | 11013 | 2518.0 |
| D | 1 | 52 | 18341106 | 6727.11 | 10361 | 10131 | 2724.9 |
| D | 4 | 95 | 11756748 | 4310.78 | 10361 | 10131 | 2724.9 |
| D | 8 | 195 | 6066743 | 2222.66 | 10361 | 10131 | 2724.9 |
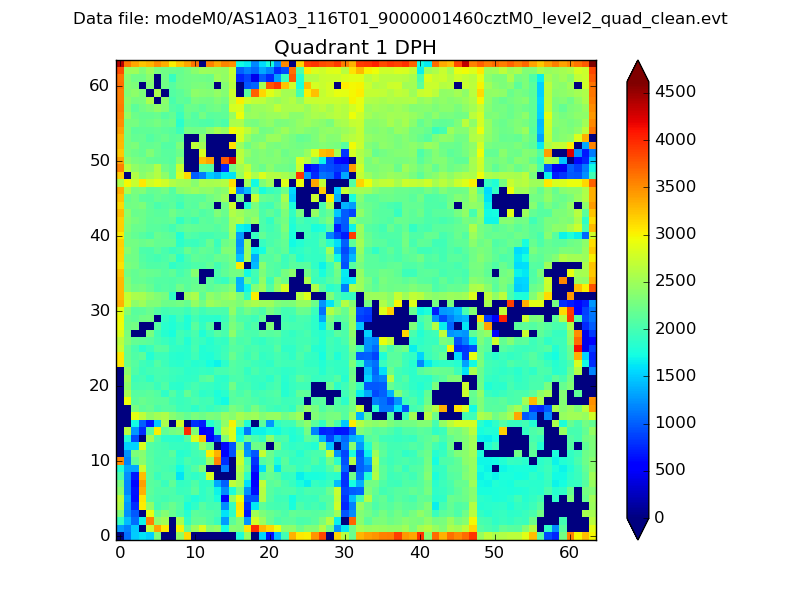
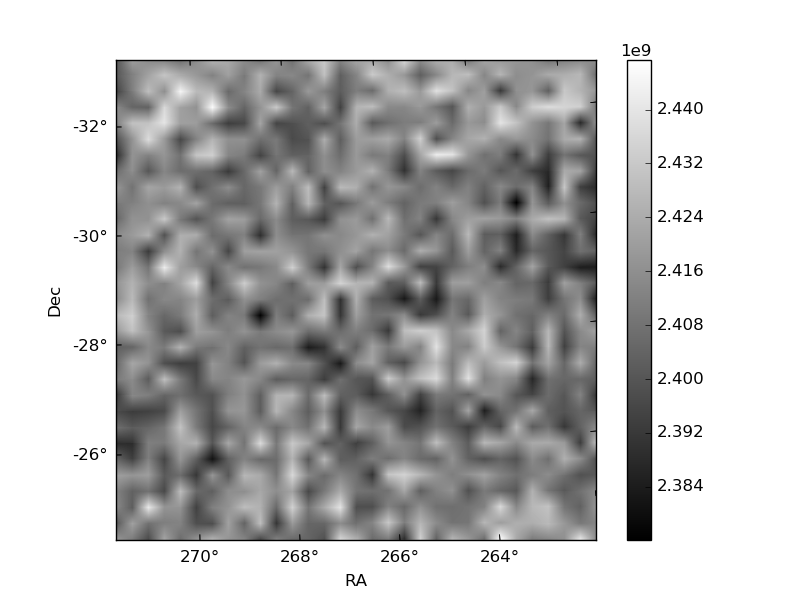
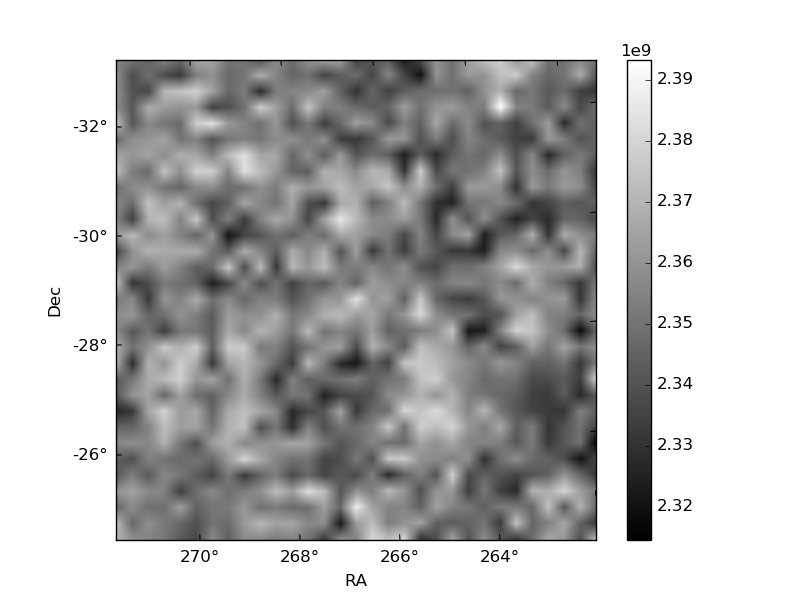
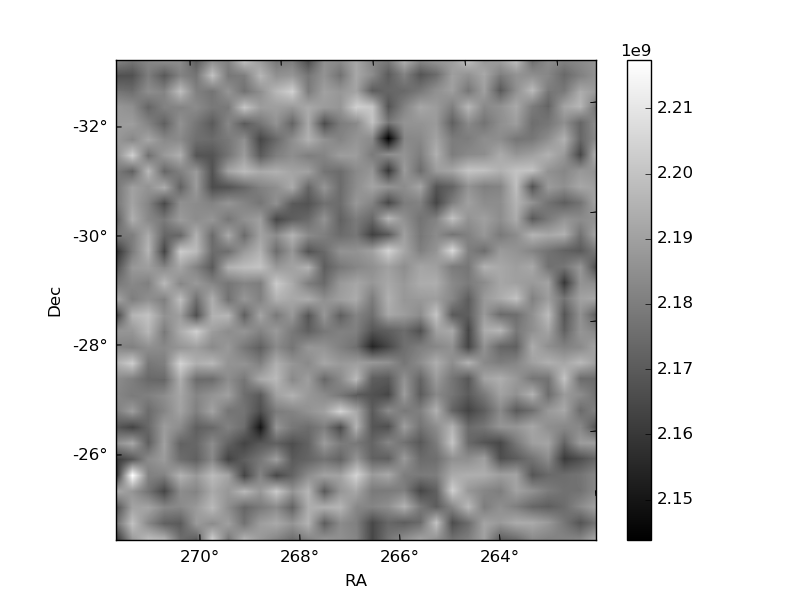
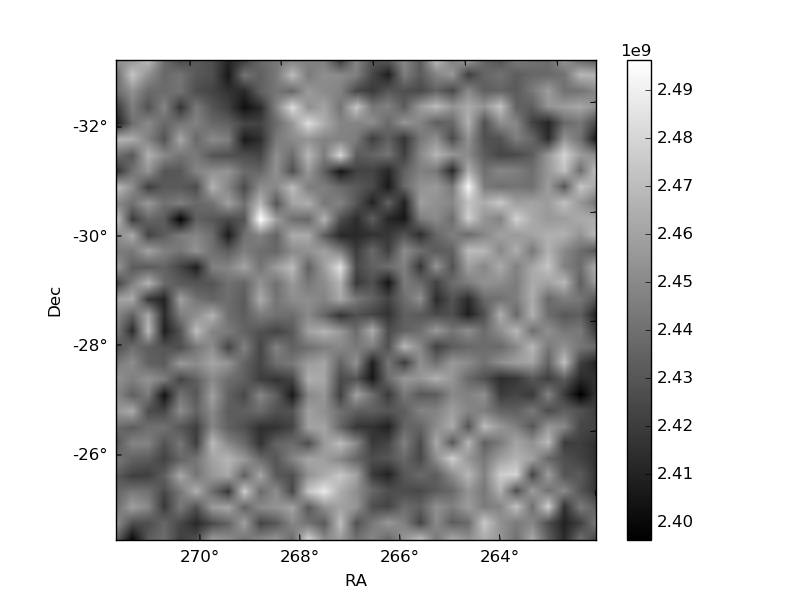
Histogram calculated using DETX and DETY for each event in the final _common_clean file
| Quadrant A |  |
 |
Quadrant B |
|---|---|---|---|
| Quadrant D | 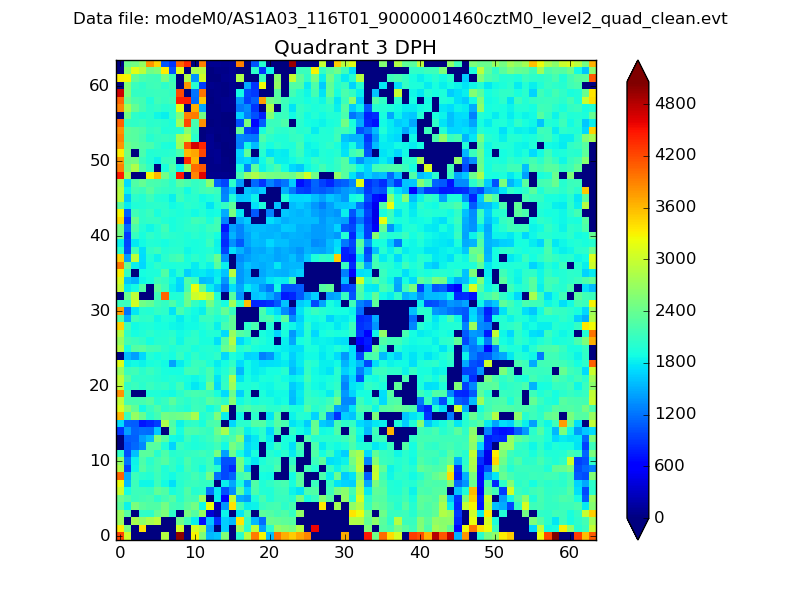 |
 |
Quadrant C |
| Plot type | Count rate plots | Images |
|---|---|---|
| Comparison with Poisson distribution Blue bars denote a histogram of data divided into 1 sec bins. Red curve is a Poisson curve with rate = median count rate of data. |
 |
 |
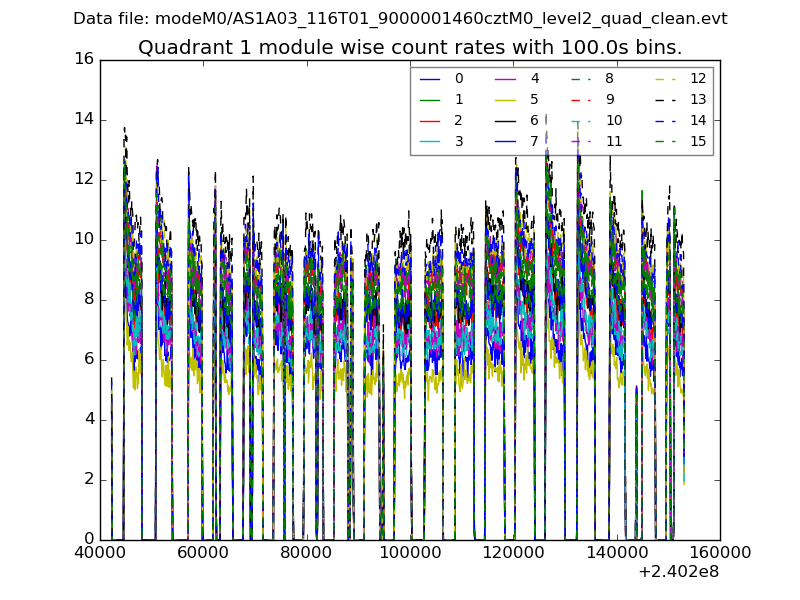
| Quadrant-wise count rates Data is divided into 100 sec bins |
 |
|
| Module-wise count rates for Quadrant A Data is divided into 100 sec bins |
 |
 |
| Module-wise count rates for Quadrant B Data is divided into 100 sec bins |
 |
 |
| Module-wise count rates for Quadrant C Data is divided into 100 sec bins |
 |
 |
| Module-wise count rates for Quadrant D Data is divided into 100 sec bins |
 |
 |
| Parameter | Plot |
|---|---|
| CZT HV Monitor | 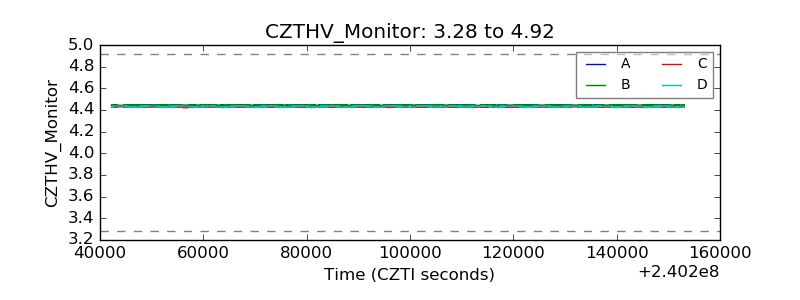 |
| D_VDD |  |
| Temperature 1 |  |
| Veto HV Monitor |  |
| Veto LLD |  |
| Alpha Counter |  |
| _CPM_Rate | 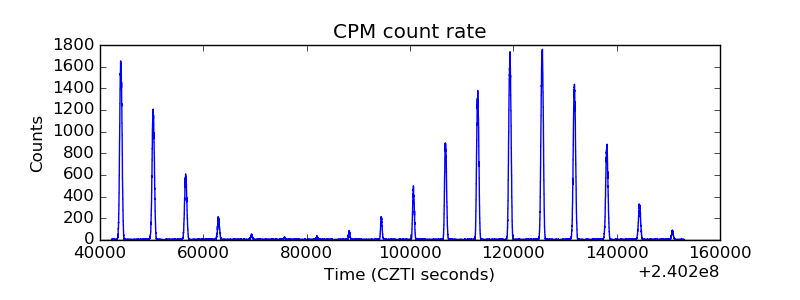 |
| CZT Counter | 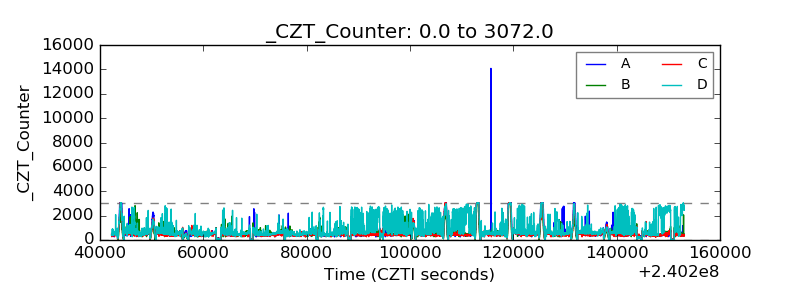 |
| +2.5 Volts monitor |  |
| +5 Volts monitor | 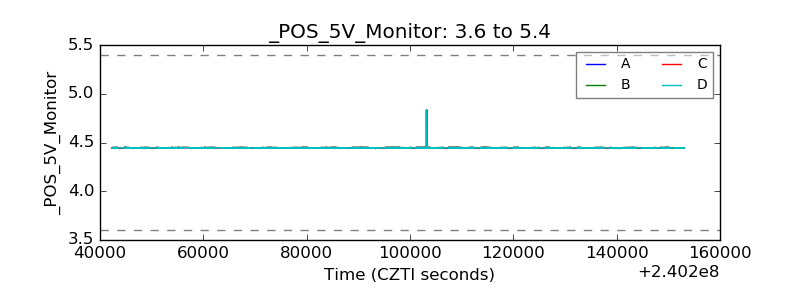 |
| _ROLL_ROT | 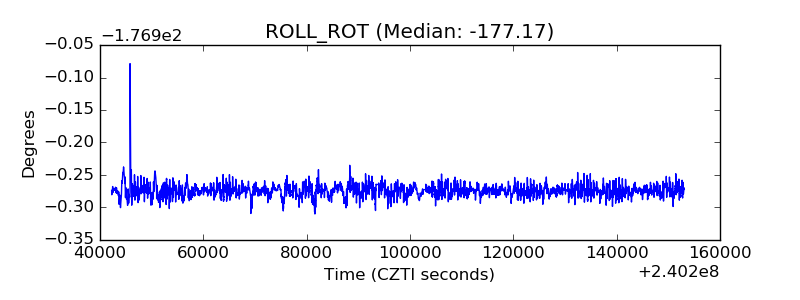 |
| _Roll_DEC |  |
| _Roll_RA |  |
| Veto Counter |  |