| Param | Original file | Final file |
|---|---|---|
| Filename | modeM0/AS1G07_072T01_9000001452cztM0_level2.evt | modeM0/AS1G07_072T01_9000001452cztM0_level2_quad_clean.evt |
| Size (bytes) | 2,310,736,320 | 451,647,360 |
| Size | 2.2 GB | 430.7 MB |
| Events in quadrant A | 15,347,834 | 2,903,231 |
| Events in quadrant B | 16,567,790 | 2,937,155 |
| Events in quadrant C | 15,224,506 | 2,894,789 |
| Events in quadrant D | 20,666,650 | 2,732,386 |
| Mode M0 | |||
|---|---|---|---|
| Quadrant | BADHDUFLAG | Total packets | Discarded packets |
| A | 0 | 67141 | 0 |
| B | 0 | 70018 | 0 |
| C | 0 | 67446 | 0 |
| D | 0 | 82549 | 0 |
| Mode M9 | |||
|---|---|---|---|
| Quadrant | BADHDUFLAG | Total packets | Discarded packets |
| A | 0 | 81 | 0 |
| B | 0 | 80 | 0 |
| C | 0 | 80 | 0 |
| D | 0 | 82 | 0 |
| Mode SS | |||
|---|---|---|---|
| Quadrant | BADHDUFLAG | Total packets | Discarded packets |
| A | 0 | 657 | 0 |
| B | 0 | 658 | 0 |
| C | 0 | 656 | 0 |
| D | 0 | 660 | 0 |
| Quadrant | Total seconds | Saturated seconds | Saturation percentage |
|---|---|---|---|
| A | 32223 | 427 | 1.325140% |
| B | 32227 | 504 | 1.563906% |
| C | 32239 | 375 | 1.163187% |
| D | 32101 | 770 | 2.398679% |
Noise dominated data is calculated using 1-second bins in cleaned event files. If a bin has >2000 counts, and if more than 50% of those come from <1% of pixels, then it is considered to be noise-dominated and hence unusable.
| Quadrant | # 1 sec bins | Bins with >0 counts | Bins with >2000 counts | High rate bins dominated by noise | Noise dominated (total time) | Noise dominated (detector-on time) | Marked lightcurve |
|---|---|---|---|---|---|---|---|
| A | 86562 | 32680 | 0 | 0 | 0.00% | 0.00% |  |
| B | 86562 | 32685 | 42 | 42 | 0.05% | 0.13% |  |
| C | 86562 | 32690 | 67 | 67 | 0.08% | 0.20% |  |
| D | 86562 | 32635 | 385 | 385 | 0.44% | 1.18% | 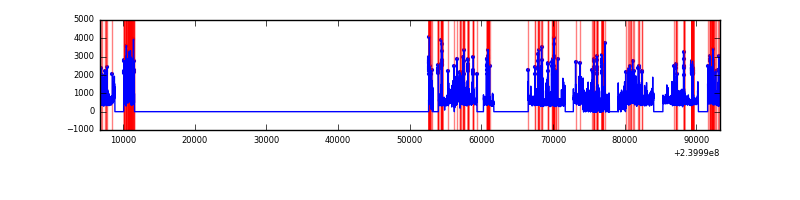 |
Top three noisy pixels from each quadrant. If the there are fewer than three noisy pixels in the level2.evt file, extra rows are filled as -1
| Pixel properties | Quadrant properties | ||||||
|---|---|---|---|---|---|---|---|
| Quadrant | DetID | PixID | Counts | Sigma | Mean | Median | Sigma |
| A | 0 | 226 | 36967 | 41.52 | 3970 | 3887 | 796.7 |
| A | 8 | 15 | 33745 | 37.48 | 3970 | 3887 | 796.7 |
| A | 12 | 194 | 33302 | 36.92 | 3970 | 3887 | 796.7 |
| B | 0 | 214 | 303721 | 401.42 | 3976 | 3883 | 746.9 |
| B | 4 | 239 | 196234 | 257.52 | 3976 | 3883 | 746.9 |
| B | 0 | 219 | 195027 | 255.9 | 3976 | 3883 | 746.9 |
| C | 10 | 22 | 231724 | 260.44 | 3815 | 3836 | 875.0 |
| C | 14 | 234 | 49794 | 52.52 | 3815 | 3836 | 875.0 |
| C | 14 | 67 | 32929 | 33.25 | 3815 | 3836 | 875.0 |
| D | 1 | 52 | 2940187 | 2953.95 | 3755 | 3678 | 994.1 |
| D | 2 | 16 | 693052 | 693.47 | 3755 | 3678 | 994.1 |
| D | 0 | 11 | 684970 | 685.34 | 3755 | 3678 | 994.1 |
Histogram calculated using DETX and DETY for each event in the final _common_clean file
| Quadrant A |  |
 |
Quadrant B |
|---|---|---|---|
| Quadrant D |  |
 |
Quadrant C |
| Plot type | Count rate plots | Images |
|---|---|---|
| Comparison with Poisson distribution Blue bars denote a histogram of data divided into 1 sec bins. Red curve is a Poisson curve with rate = median count rate of data. |
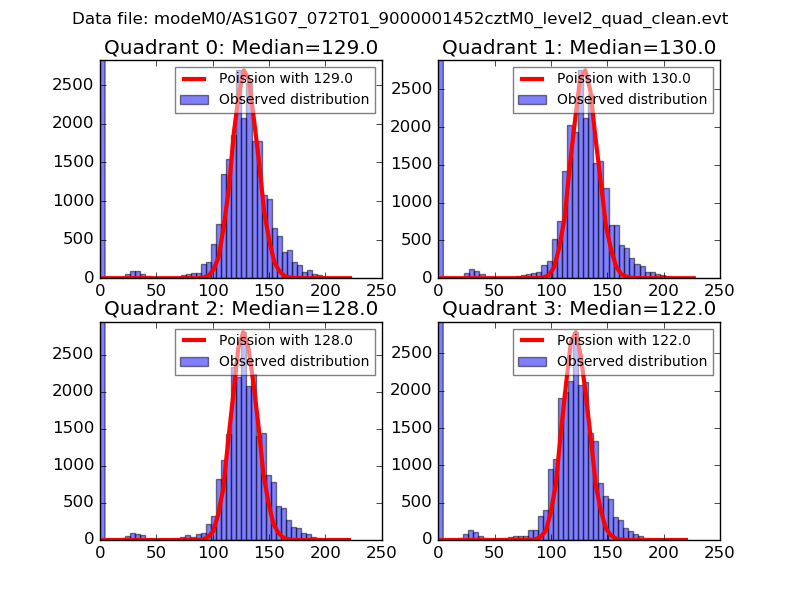 |
 |
| Quadrant-wise count rates Data is divided into 100 sec bins |
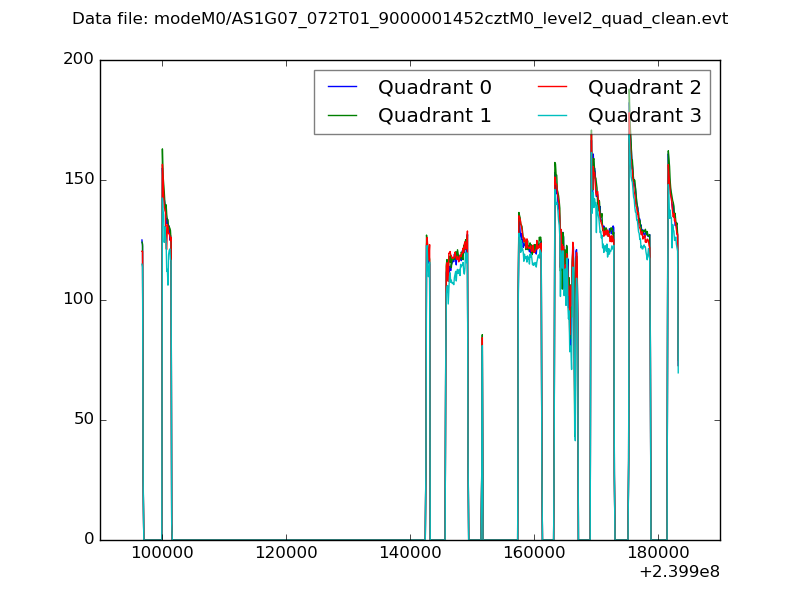 |
|
| Module-wise count rates for Quadrant A Data is divided into 100 sec bins |
 |
 |
| Module-wise count rates for Quadrant B Data is divided into 100 sec bins |
 |
 |
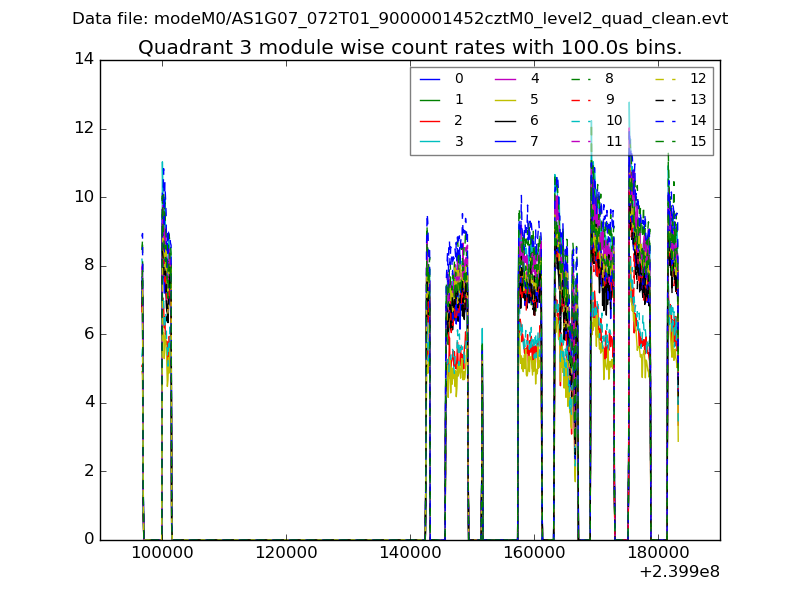
| Module-wise count rates for Quadrant C Data is divided into 100 sec bins |
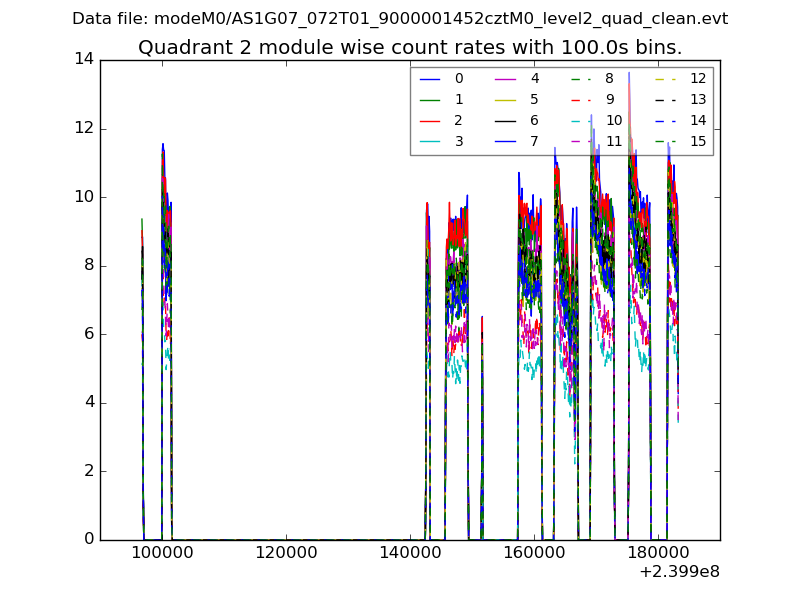 |
 |
| Module-wise count rates for Quadrant D Data is divided into 100 sec bins |
 |
 |
| Parameter | Plot |
|---|---|
| CZT HV Monitor | 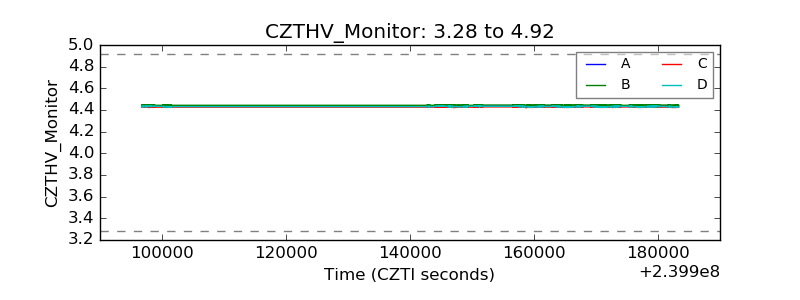 |
| D_VDD |  |
| Temperature 1 |  |
| Veto HV Monitor |  |
| Veto LLD | 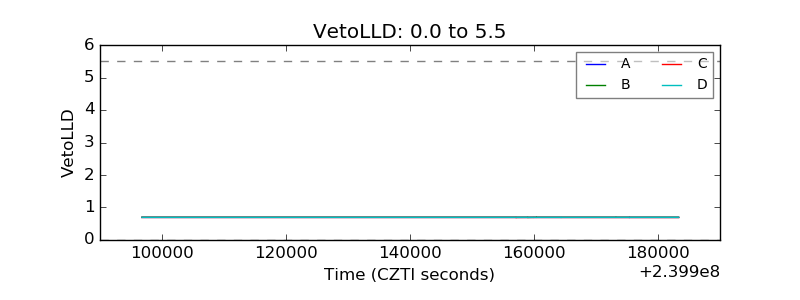 |
| Alpha Counter |  |
| _CPM_Rate |  |
| CZT Counter |  |
| +2.5 Volts monitor |  |
| +5 Volts monitor |  |
| _ROLL_ROT |  |
| _Roll_DEC |  |
| _Roll_RA |  |
| Veto Counter |  |