| Param | Original file | Final file |
|---|---|---|
| Filename | modeM0/AS1A03_044T04_9000001448cztM0_level2.evt | modeM0/AS1A03_044T04_9000001448cztM0_level2_quad_clean.evt |
| Size (bytes) | 936,132,480 | 167,402,880 |
| Size | 892.8 MB | 159.6 MB |
| Events in quadrant A | 6,529,203 | 1,027,320 |
| Events in quadrant B | 6,693,494 | 1,047,566 |
| Events in quadrant C | 6,336,835 | 1,034,215 |
| Events in quadrant D | 7,824,679 | 977,654 |
| Mode M9 | |||
|---|---|---|---|
| Quadrant | BADHDUFLAG | Total packets | Discarded packets |
| A | 1 | 273359709408 | 0 |
| B | 1 | 273359709408 | 0 |
| C | 1 | 273359709408 | 0 |
| D | 1 | 273359709408 | 0 |
| Mode M0 | |||
|---|---|---|---|
| Quadrant | BADHDUFLAG | Total packets | Discarded packets |
| A | 0 | 29491 | 0 |
| B | 0 | 29617 | 0 |
| C | 0 | 29279 | 0 |
| D | 0 | 32621 | 0 |
| Mode SS | |||
|---|---|---|---|
| Quadrant | BADHDUFLAG | Total packets | Discarded packets |
| A | 0 | 302 | 0 |
| B | 0 | 262 | 0 |
| C | 0 | 292 | 0 |
| D | 0 | 350 | 0 |
| Quadrant | Total seconds | Saturated seconds | Saturation percentage |
|---|---|---|---|
| A | 14222 | 132 | 0.928140% |
| B | 14193 | 157 | 1.106179% |
| C | 14317 | 63 | 0.440036% |
| D | 13896 | 194 | 1.396085% |
Noise dominated data is calculated using 1-second bins in cleaned event files. If a bin has >2000 counts, and if more than 50% of those come from <1% of pixels, then it is considered to be noise-dominated and hence unusable.
| Quadrant | # 1 sec bins | Bins with >0 counts | Bins with >2000 counts | High rate bins dominated by noise | Noise dominated (total time) | Noise dominated (detector-on time) | Marked lightcurve |
|---|---|---|---|---|---|---|---|
| A | 23142 | 16160 | 3 | 3 | 0.01% | 0.02% |  |
| B | 23142 | 16226 | 2 | 2 | 0.01% | 0.01% | 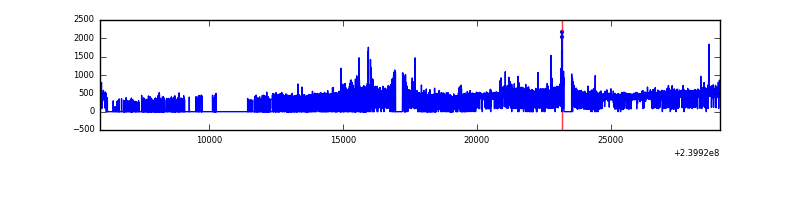 |
| C | 23142 | 16329 | 3 | 3 | 0.01% | 0.02% |  |
| D | 23142 | 15968 | 84 | 84 | 0.36% | 0.53% |  |
Top three noisy pixels from each quadrant. If the there are fewer than three noisy pixels in the level2.evt file, extra rows are filled as -1
| Pixel properties | Quadrant properties | ||||||
|---|---|---|---|---|---|---|---|
| Quadrant | DetID | PixID | Counts | Sigma | Mean | Median | Sigma |
| A | 0 | 8 | 102615 | 300.66 | 1652 | 1614 | 335.9 |
| A | 8 | 15 | 30567 | 86.19 | 1652 | 1614 | 335.9 |
| A | 4 | 2 | 27272 | 76.38 | 1652 | 1614 | 335.9 |
| B | 0 | 214 | 113328 | 349.8 | 1654 | 1609 | 319.4 |
| B | 0 | 219 | 44972 | 135.77 | 1654 | 1609 | 319.4 |
| B | 4 | 239 | 42370 | 127.63 | 1654 | 1609 | 319.4 |
| C | 14 | 234 | 17340 | 41.75 | 1616 | 1623 | 376.5 |
| C | 13 | 61 | 11970 | 27.48 | 1616 | 1623 | 376.5 |
| C | 14 | 67 | 11615 | 26.54 | 1616 | 1623 | 376.5 |
| D | 8 | 195 | 751928 | 1912.17 | 1552 | 1512 | 392.4 |
| D | 10 | 199 | 481335 | 1222.66 | 1552 | 1512 | 392.4 |
| D | 2 | 152 | 231882 | 587.01 | 1552 | 1512 | 392.4 |
Histogram calculated using DETX and DETY for each event in the final _common_clean file
| Quadrant A | 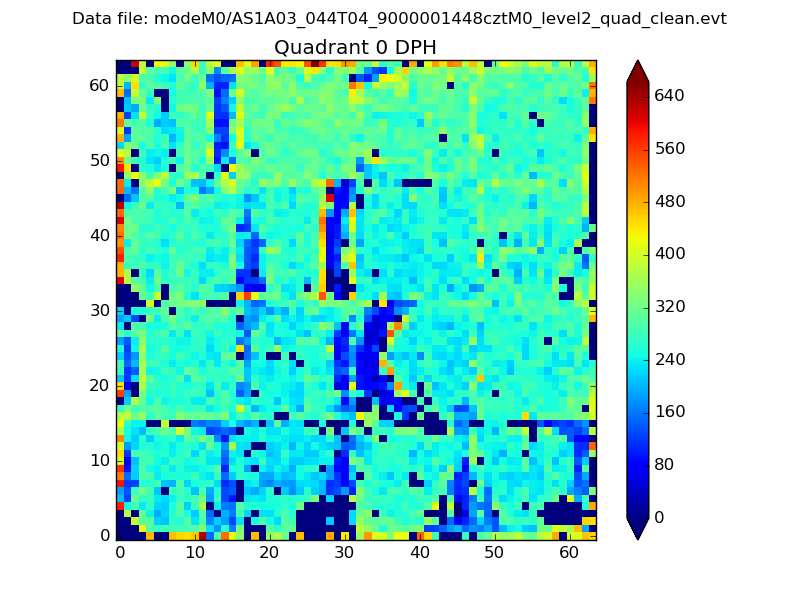 |
 |
Quadrant B |
|---|---|---|---|
| Quadrant D |  |
 |
Quadrant C |
| Plot type | Count rate plots | Images |
|---|---|---|
| Comparison with Poisson distribution Blue bars denote a histogram of data divided into 1 sec bins. Red curve is a Poisson curve with rate = median count rate of data. |
 |
 |
| Quadrant-wise count rates Data is divided into 100 sec bins |
 |
|
| Module-wise count rates for Quadrant A Data is divided into 100 sec bins |
 |
 |
| Module-wise count rates for Quadrant B Data is divided into 100 sec bins |
 |
 |
| Module-wise count rates for Quadrant C Data is divided into 100 sec bins |
 |
 |
| Module-wise count rates for Quadrant D Data is divided into 100 sec bins |
 |
 |
| Parameter | Plot |
|---|---|
| CZT HV Monitor |  |
| D_VDD | 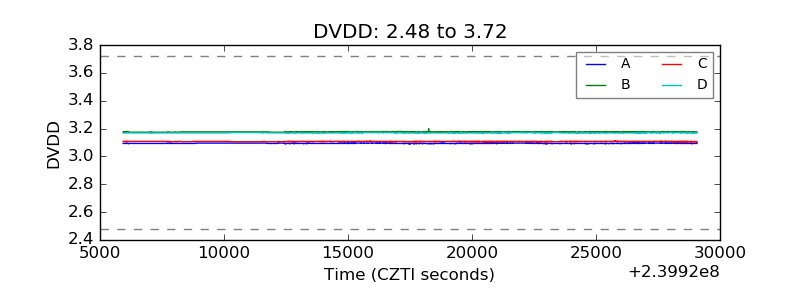 |
| Temperature 1 |  |
| Veto HV Monitor |  |
| Veto LLD |  |
| Alpha Counter |  |
| _CPM_Rate |  |
| CZT Counter |  |
| +2.5 Volts monitor |  |
| +5 Volts monitor |  |
| _ROLL_ROT |  |
| _Roll_DEC |  |
| _Roll_RA |  |
| Veto Counter |  |