| Param | Original file | Final file |
|---|---|---|
| Filename | modeM0/AS1A03_084T01_9000001440cztM0_level2.evt | modeM0/AS1A03_084T01_9000001440cztM0_level2_quad_clean.evt |
| Size (bytes) | 2,105,288,640 | 336,404,160 |
| Size | 2.0 GB | 320.8 MB |
| Events in quadrant A | 13,452,227 | 2,140,902 |
| Events in quadrant B | 13,566,104 | 2,165,914 |
| Events in quadrant C | 12,256,653 | 2,104,856 |
| Events in quadrant D | 22,690,358 | 1,948,306 |
| Mode M9 | |||
|---|---|---|---|
| Quadrant | BADHDUFLAG | Total packets | Discarded packets |
| A | 0 | 69 | 0 |
| B | 0 | 69 | 0 |
| C | 0 | 69 | 0 |
| D | 0 | 69 | 0 |
| Mode M0 | |||
|---|---|---|---|
| Quadrant | BADHDUFLAG | Total packets | Discarded packets |
| A | 0 | 57863 | 0 |
| B | 0 | 57798 | 0 |
| C | 0 | 54927 | 0 |
| D | 0 | 85662 | 0 |
| Mode SS | |||
|---|---|---|---|
| Quadrant | BADHDUFLAG | Total packets | Discarded packets |
| A | 0 | 550 | 0 |
| B | 0 | 550 | 0 |
| C | 0 | 550 | 0 |
| D | 0 | 550 | 0 |
| Quadrant | Total seconds | Saturated seconds | Saturation percentage |
|---|---|---|---|
| A | 26570 | 333 | 1.253293% |
| B | 26578 | 316 | 1.188953% |
| C | 26586 | 146 | 0.549161% |
| D | 26556 | 2218 | 8.352161% |
Noise dominated data is calculated using 1-second bins in cleaned event files. If a bin has >2000 counts, and if more than 50% of those come from <1% of pixels, then it is considered to be noise-dominated and hence unusable.
| Quadrant | # 1 sec bins | Bins with >0 counts | Bins with >2000 counts | High rate bins dominated by noise | Noise dominated (total time) | Noise dominated (detector-on time) | Marked lightcurve |
|---|---|---|---|---|---|---|---|
| A | 33748 | 26696 | 54 | 54 | 0.16% | 0.20% |  |
| B | 33748 | 26697 | 33 | 33 | 0.10% | 0.12% | 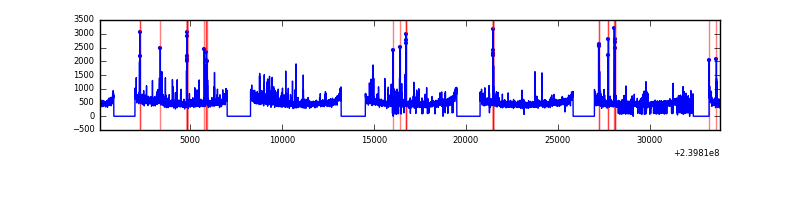 |
| C | 33748 | 26702 | 2 | 2 | 0.01% | 0.01% |  |
| D | 33748 | 26678 | 1976 | 1976 | 5.86% | 7.41% |  |
Top three noisy pixels from each quadrant. If the there are fewer than three noisy pixels in the level2.evt file, extra rows are filled as -1
| Pixel properties | Quadrant properties | ||||||
|---|---|---|---|---|---|---|---|
| Quadrant | DetID | PixID | Counts | Sigma | Mean | Median | Sigma |
| A | 0 | 8 | 373107 | 569.19 | 3239 | 3171 | 649.9 |
| A | 15 | 239 | 234831 | 356.44 | 3239 | 3171 | 649.9 |
| A | 8 | 15 | 222769 | 337.88 | 3239 | 3171 | 649.9 |
| B | 4 | 81 | 290540 | 470.99 | 3254 | 3186 | 610.1 |
| B | 4 | 239 | 199793 | 322.25 | 3254 | 3186 | 610.1 |
| B | 0 | 214 | 158793 | 255.05 | 3254 | 3186 | 610.1 |
| C | 14 | 67 | 55553 | 72.52 | 3119 | 3131 | 722.8 |
| C | 14 | 234 | 32795 | 41.04 | 3119 | 3131 | 722.8 |
| C | 13 | 61 | 23917 | 28.76 | 3119 | 3131 | 722.8 |
| D | 1 | 52 | 4597604 | 5739.58 | 2992 | 2930 | 800.5 |
| D | 2 | 16 | 2702687 | 3372.48 | 2992 | 2930 | 800.5 |
| D | 4 | 95 | 2569654 | 3206.3 | 2992 | 2930 | 800.5 |
Histogram calculated using DETX and DETY for each event in the final _common_clean file
| Quadrant A |  |
 |
Quadrant B |
|---|---|---|---|
| Quadrant D |  |
 |
Quadrant C |
| Plot type | Count rate plots | Images |
|---|---|---|
| Comparison with Poisson distribution Blue bars denote a histogram of data divided into 1 sec bins. Red curve is a Poisson curve with rate = median count rate of data. |
 |
 |
| Quadrant-wise count rates Data is divided into 100 sec bins |
 |
|
| Module-wise count rates for Quadrant A Data is divided into 100 sec bins |
 |
 |
| Module-wise count rates for Quadrant B Data is divided into 100 sec bins |
 |
 |
| Module-wise count rates for Quadrant C Data is divided into 100 sec bins |
 |
 |
| Module-wise count rates for Quadrant D Data is divided into 100 sec bins |
 |
 |
| Parameter | Plot |
|---|---|
| CZT HV Monitor |  |
| D_VDD |  |
| Temperature 1 |  |
| Veto HV Monitor |  |
| Veto LLD | 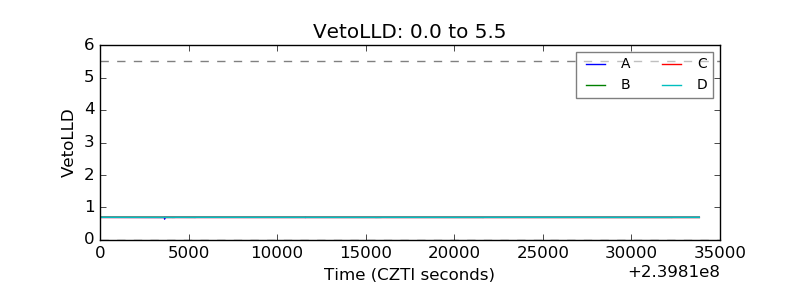 |
| Alpha Counter | 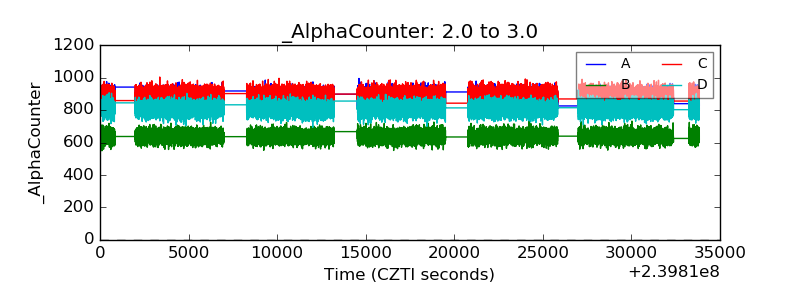 |
| _CPM_Rate | 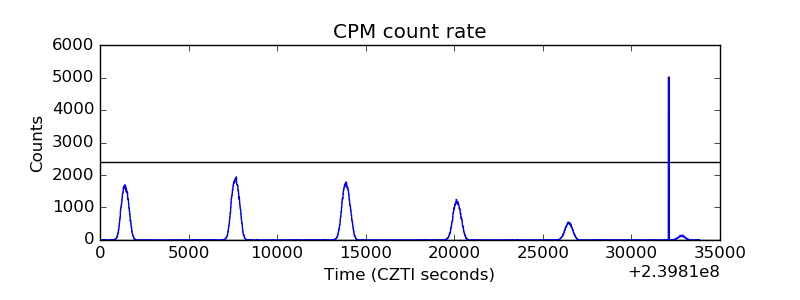 |
| CZT Counter |  |
| +2.5 Volts monitor |  |
| +5 Volts monitor |  |
| _ROLL_ROT |  |
| _Roll_DEC |  |
| _Roll_RA |  |
| Veto Counter |  |