| Param | Original file | Final file |
|---|---|---|
| Filename | modeM0/AS1A03_033T01_9000001438cztM0_level2.evt | modeM0/AS1A03_033T01_9000001438cztM0_level2_quad_clean.evt |
| Size (bytes) | 1,582,139,520 | 278,527,680 |
| Size | 1.5 GB | 265.6 MB |
| Events in quadrant A | 10,914,700 | 1,737,342 |
| Events in quadrant B | 11,040,298 | 1,761,160 |
| Events in quadrant C | 10,161,607 | 1,719,183 |
| Events in quadrant D | 14,248,530 | 1,641,694 |
| Mode SS | |||
|---|---|---|---|
| Quadrant | BADHDUFLAG | Total packets | Discarded packets |
| A | 0 | 466 | 0 |
| B | 0 | 470 | 0 |
| C | 0 | 469 | 0 |
| D | 0 | 464 | 0 |
| Mode M9 | |||
|---|---|---|---|
| Quadrant | BADHDUFLAG | Total packets | Discarded packets |
| A | 0 | 35 | 0 |
| B | 0 | 34 | 0 |
| C | 0 | 35 | 0 |
| D | 0 | 35 | 0 |
| Mode M0 | |||
|---|---|---|---|
| Quadrant | BADHDUFLAG | Total packets | Discarded packets |
| A | 0 | 48039 | 0 |
| B | 0 | 47971 | 0 |
| C | 0 | 46523 | 0 |
| D | 0 | 56977 | 0 |
| Quadrant | Total seconds | Saturated seconds | Saturation percentage |
|---|---|---|---|
| A | 22944 | 275 | 1.198570% |
| B | 22957 | 316 | 1.376486% |
| C | 22978 | 171 | 0.744190% |
| D | 22658 | 542 | 2.392091% |
Noise dominated data is calculated using 1-second bins in cleaned event files. If a bin has >2000 counts, and if more than 50% of those come from <1% of pixels, then it is considered to be noise-dominated and hence unusable.
| Quadrant | # 1 sec bins | Bins with >0 counts | Bins with >2000 counts | High rate bins dominated by noise | Noise dominated (total time) | Noise dominated (detector-on time) | Marked lightcurve |
|---|---|---|---|---|---|---|---|
| A | 28202 | 24122 | 25 | 25 | 0.09% | 0.10% |  |
| B | 28202 | 24124 | 64 | 64 | 0.23% | 0.27% | 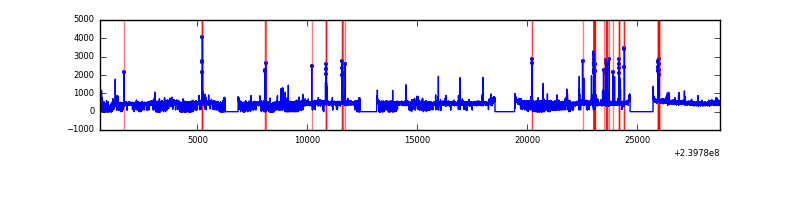 |
| C | 28202 | 24147 | 2 | 2 | 0.01% | 0.01% |  |
| D | 28202 | 23924 | 314 | 314 | 1.11% | 1.31% |  |
Top three noisy pixels from each quadrant. If the there are fewer than three noisy pixels in the level2.evt file, extra rows are filled as -1
| Pixel properties | Quadrant properties | ||||||
|---|---|---|---|---|---|---|---|
| Quadrant | DetID | PixID | Counts | Sigma | Mean | Median | Sigma |
| A | 15 | 239 | 417477 | 779.24 | 2666 | 2608 | 532.4 |
| A | 8 | 15 | 207451 | 384.75 | 2666 | 2608 | 532.4 |
| A | 0 | 226 | 24289 | 40.72 | 2666 | 2608 | 532.4 |
| B | 10 | 247 | 366208 | 715.97 | 2677 | 2614 | 507.8 |
| B | 0 | 214 | 141541 | 273.57 | 2677 | 2614 | 507.8 |
| B | 12 | 111 | 56444 | 106.0 | 2677 | 2614 | 507.8 |
| C | 14 | 67 | 29732 | 45.5 | 2592 | 2605 | 596.3 |
| C | 14 | 234 | 19374 | 28.12 | 2592 | 2605 | 596.3 |
| C | 13 | 61 | 19128 | 27.71 | 2592 | 2605 | 596.3 |
| D | 2 | 16 | 2235021 | 3456.68 | 2536 | 2479 | 645.9 |
| D | 1 | 52 | 1056578 | 1632.08 | 2536 | 2479 | 645.9 |
| D | 8 | 195 | 601010 | 926.72 | 2536 | 2479 | 645.9 |
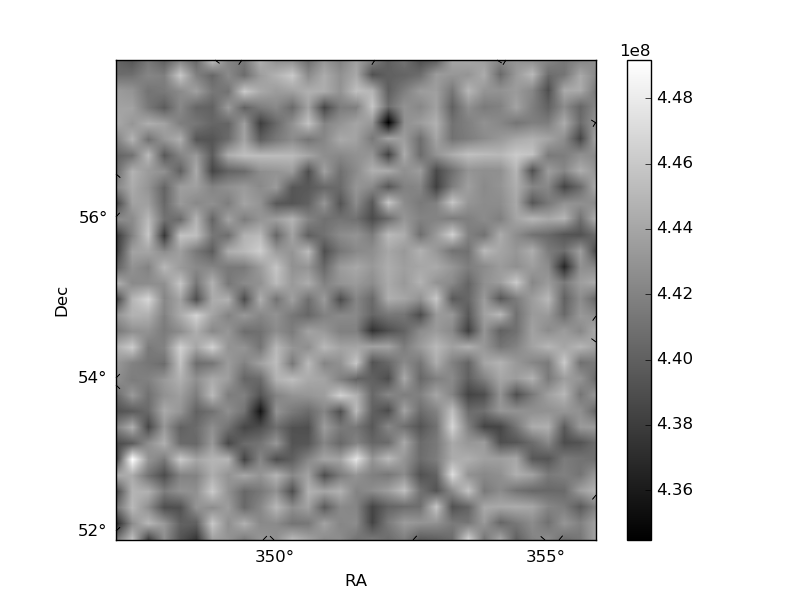
Histogram calculated using DETX and DETY for each event in the final _common_clean file
| Quadrant A |  |
 |
Quadrant B |
|---|---|---|---|
| Quadrant D | 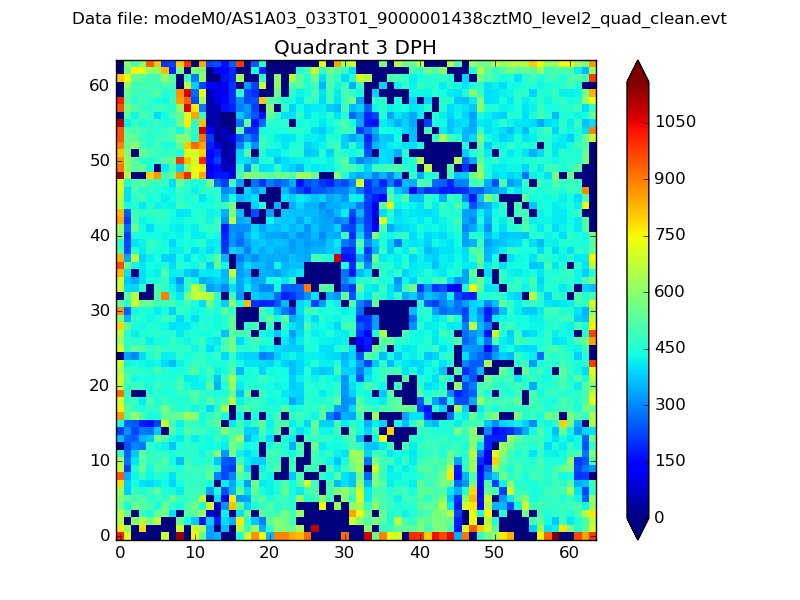 |
 |
Quadrant C |
| Plot type | Count rate plots | Images |
|---|---|---|
| Comparison with Poisson distribution Blue bars denote a histogram of data divided into 1 sec bins. Red curve is a Poisson curve with rate = median count rate of data. |
 |
 |
| Quadrant-wise count rates Data is divided into 100 sec bins |
 |
|
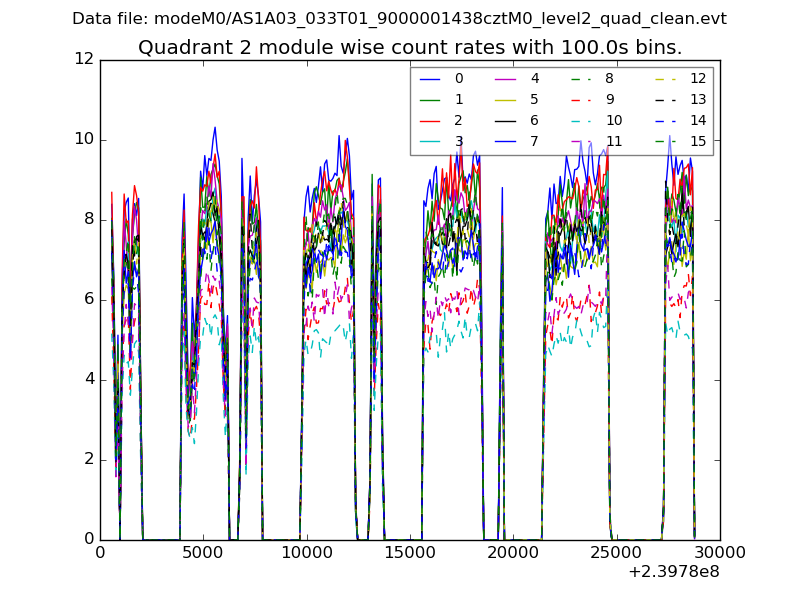
| Module-wise count rates for Quadrant A Data is divided into 100 sec bins |
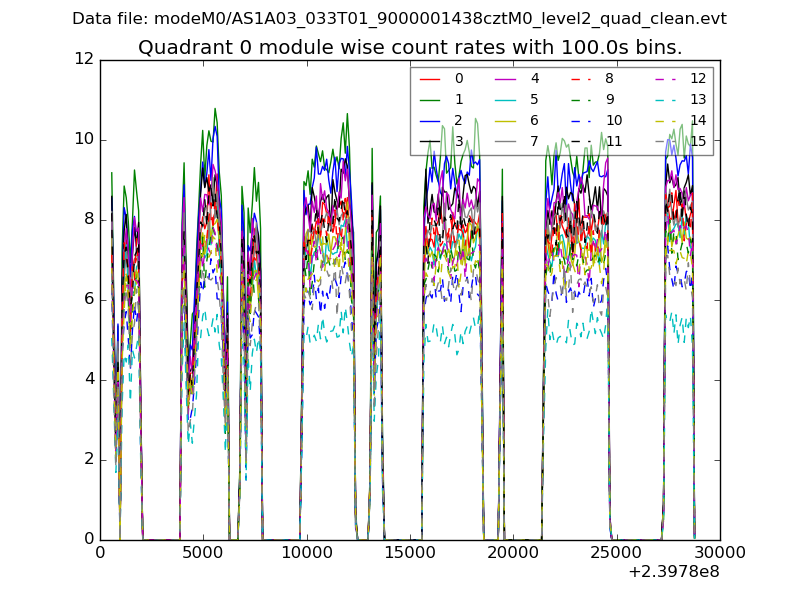 |
 |
| Module-wise count rates for Quadrant B Data is divided into 100 sec bins |
 |
 |
| Module-wise count rates for Quadrant C Data is divided into 100 sec bins |
 |
 |
| Module-wise count rates for Quadrant D Data is divided into 100 sec bins |
 |
 |
| Parameter | Plot |
|---|---|
| CZT HV Monitor |  |
| D_VDD | 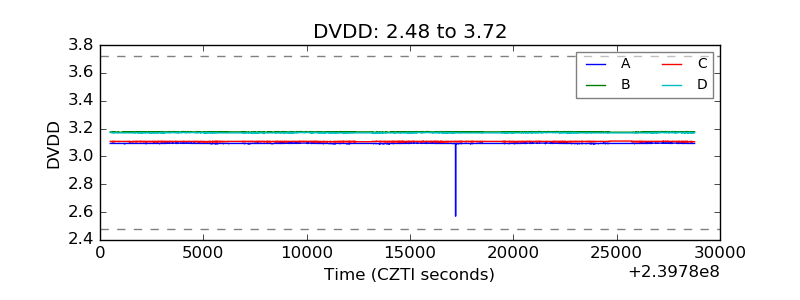 |
| Temperature 1 | 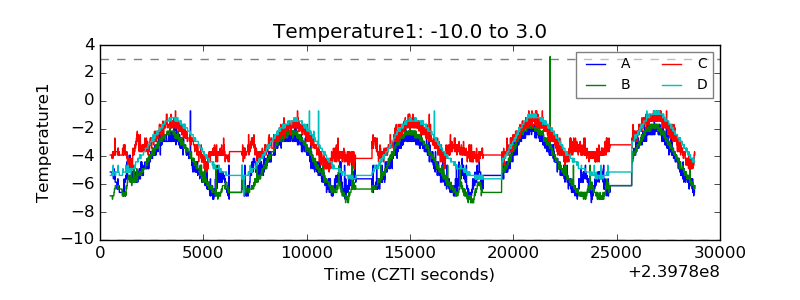 |
| Veto HV Monitor | 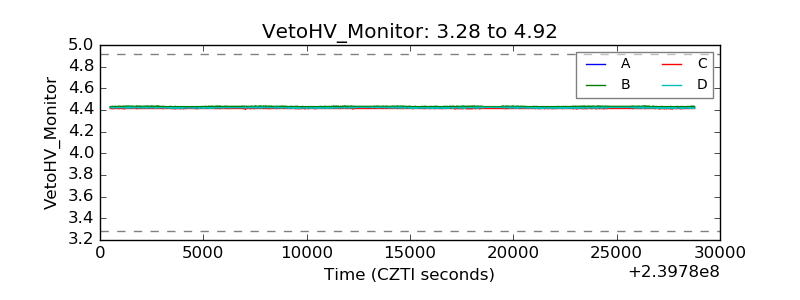 |
| Veto LLD |  |
| Alpha Counter | 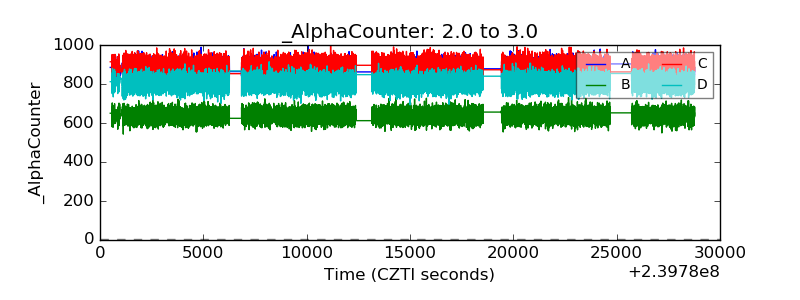 |
| _CPM_Rate |  |
| CZT Counter | 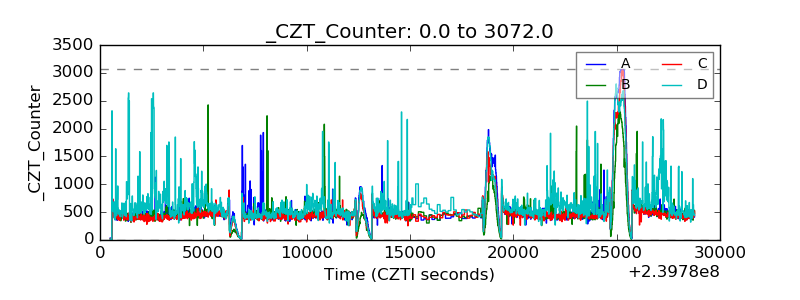 |
| +2.5 Volts monitor | 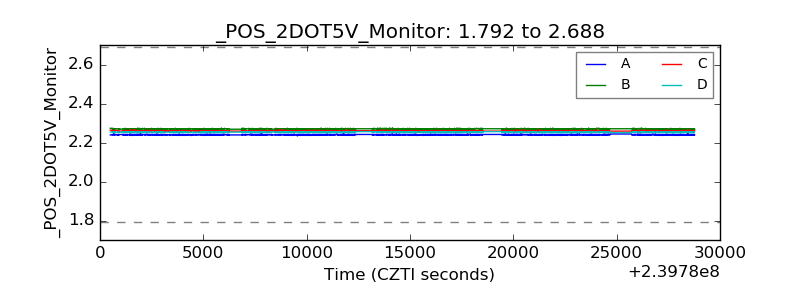 |
| +5 Volts monitor |  |
| _ROLL_ROT |  |
| _Roll_DEC | 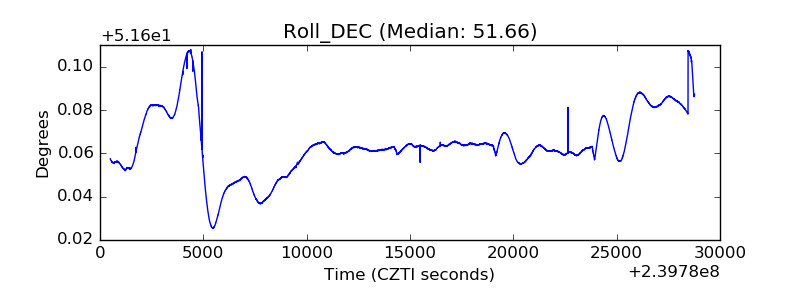 |
| _Roll_RA | 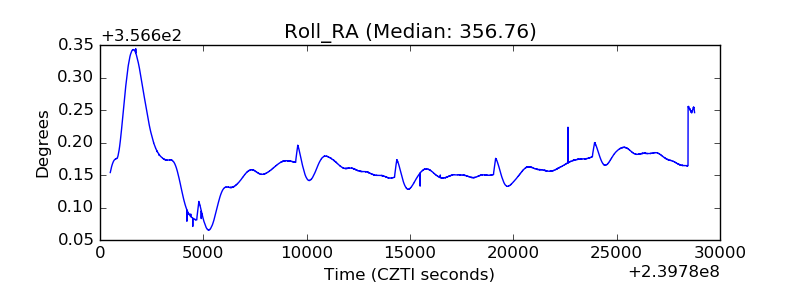 |
| Veto Counter |  |