| Param | Original file | Final file |
|---|---|---|
| Filename | modeM0/AS1A03_052T01_9000001436cztM0_level2.evt | modeM0/AS1A03_052T01_9000001436cztM0_level2_quad_clean.evt |
| Size (bytes) | 4,308,583,680 | 735,949,440 |
| Size | 4.0 GB | 701.9 MB |
| Events in quadrant A | 30,926,250 | 4,662,034 |
| Events in quadrant B | 31,604,035 | 4,725,511 |
| Events in quadrant C | 26,649,610 | 4,615,456 |
| Events in quadrant D | 37,354,577 | 4,272,380 |
| Mode M0 | |||
|---|---|---|---|
| Quadrant | BADHDUFLAG | Total packets | Discarded packets |
| A | 0 | 130540 | 0 |
| B | 0 | 132456 | 0 |
| C | 0 | 120712 | 0 |
| D | 0 | 149364 | 0 |
| Mode SS | |||
|---|---|---|---|
| Quadrant | BADHDUFLAG | Total packets | Discarded packets |
| A | 0 | 1206 | 0 |
| B | 0 | 1214 | 0 |
| C | 0 | 1191 | 0 |
| D | 0 | 1202 | 0 |
| Mode M9 | |||
|---|---|---|---|
| Quadrant | BADHDUFLAG | Total packets | Discarded packets |
| A | 0 | 105 | 0 |
| B | 0 | 104 | 0 |
| C | 0 | 101 | 0 |
| D | 0 | 104 | 0 |
| Quadrant | Total seconds | Saturated seconds | Saturation percentage |
|---|---|---|---|
| A | 58630 | 1011 | 1.724373% |
| B | 58590 | 1196 | 2.041304% |
| C | 58869 | 433 | 0.735531% |
| D | 57712 | 2870 | 4.972969% |
Noise dominated data is calculated using 1-second bins in cleaned event files. If a bin has >2000 counts, and if more than 50% of those come from <1% of pixels, then it is considered to be noise-dominated and hence unusable.
| Quadrant | # 1 sec bins | Bins with >0 counts | Bins with >2000 counts | High rate bins dominated by noise | Noise dominated (total time) | Noise dominated (detector-on time) | Marked lightcurve |
|---|---|---|---|---|---|---|---|
| A | 75988 | 61809 | 260 | 260 | 0.34% | 0.42% |  |
| B | 75988 | 61724 | 326 | 326 | 0.43% | 0.53% |  |
| C | 75988 | 61955 | 0 | 0 | 0.00% | 0.00% | 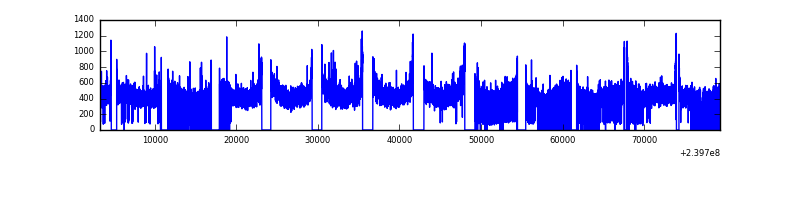 |
| D | 75988 | 60815 | 2256 | 2256 | 2.97% | 3.71% |  |
Top three noisy pixels from each quadrant. If the there are fewer than three noisy pixels in the level2.evt file, extra rows are filled as -1
| Pixel properties | Quadrant properties | ||||||
|---|---|---|---|---|---|---|---|
| Quadrant | DetID | PixID | Counts | Sigma | Mean | Median | Sigma |
| A | 8 | 15 | 2134504 | 1502.35 | 7011 | 6869 | 1416.2 |
| A | 15 | 239 | 1498546 | 1053.29 | 7011 | 6869 | 1416.2 |
| A | 15 | 174 | 254954 | 175.18 | 7011 | 6869 | 1416.2 |
| B | 4 | 81 | 2912688 | 2172.97 | 7037 | 6872 | 1337.3 |
| B | 10 | 247 | 466964 | 344.06 | 7037 | 6872 | 1337.3 |
| B | 4 | 239 | 286524 | 209.12 | 7037 | 6872 | 1337.3 |
| C | 14 | 67 | 99040 | 58.79 | 6800 | 6825 | 1568.6 |
| C | 13 | 61 | 51767 | 28.65 | 6800 | 6825 | 1568.6 |
| C | 8 | 222 | 45861 | 24.89 | 6800 | 6825 | 1568.6 |
| D | 1 | 20 | 4073833 | 2380.13 | 6520 | 6368 | 1708.9 |
| D | 2 | 16 | 2979304 | 1739.65 | 6520 | 6368 | 1708.9 |
| D | 1 | 52 | 1282626 | 746.82 | 6520 | 6368 | 1708.9 |
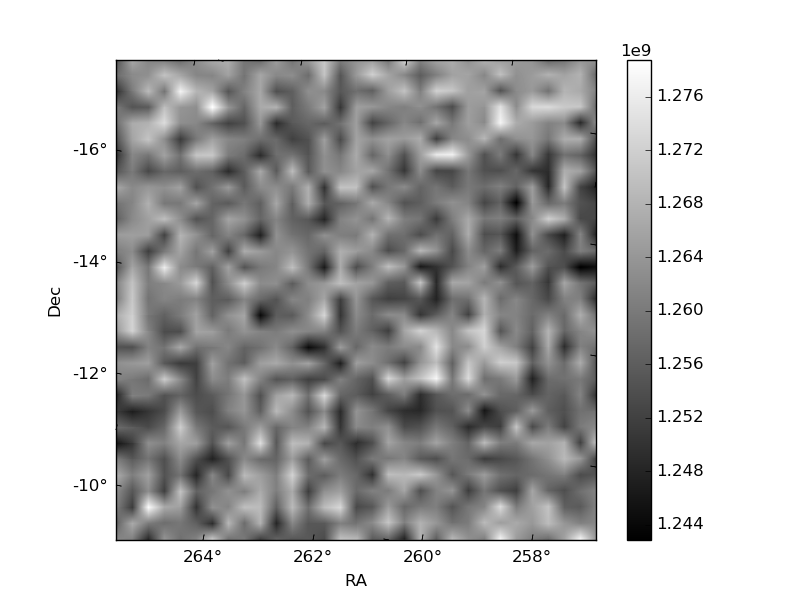
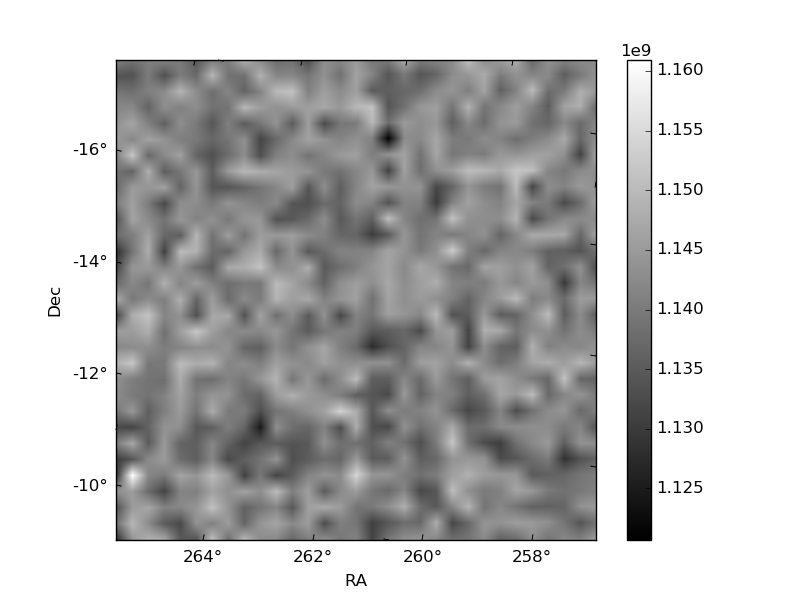
Histogram calculated using DETX and DETY for each event in the final _common_clean file
| Quadrant A |  |
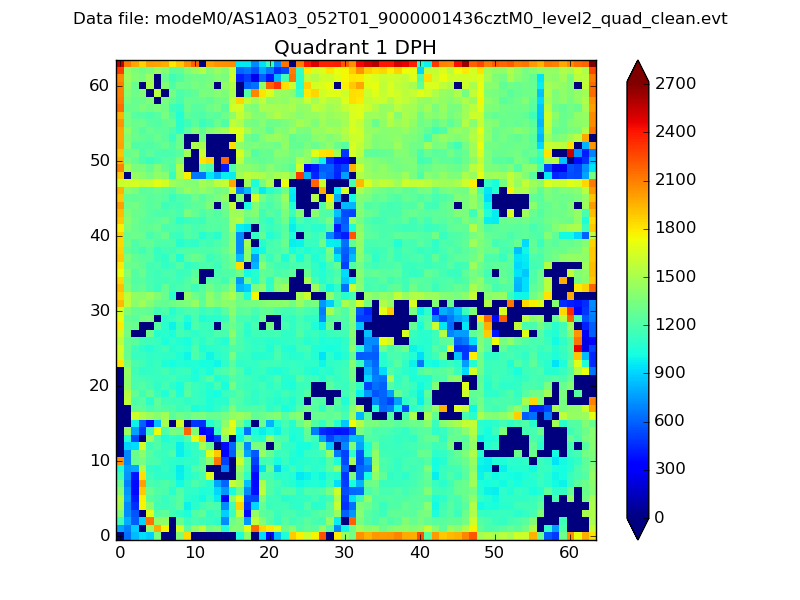 |
Quadrant B |
|---|---|---|---|
| Quadrant D | 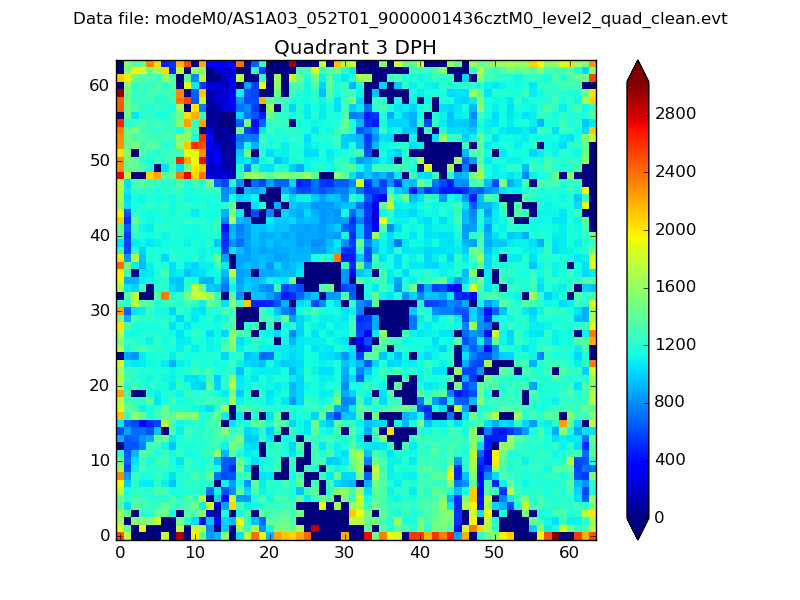 |
 |
Quadrant C |
| Plot type | Count rate plots | Images |
|---|---|---|
| Comparison with Poisson distribution Blue bars denote a histogram of data divided into 1 sec bins. Red curve is a Poisson curve with rate = median count rate of data. |
 |
 |
| Quadrant-wise count rates Data is divided into 100 sec bins |
 |
|
| Module-wise count rates for Quadrant A Data is divided into 100 sec bins |
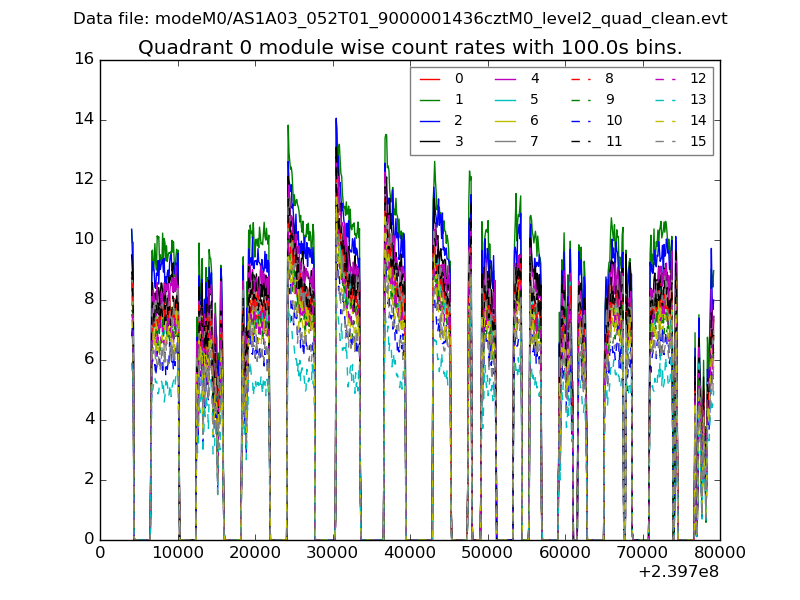 |
 |
| Module-wise count rates for Quadrant B Data is divided into 100 sec bins |
 |
 |
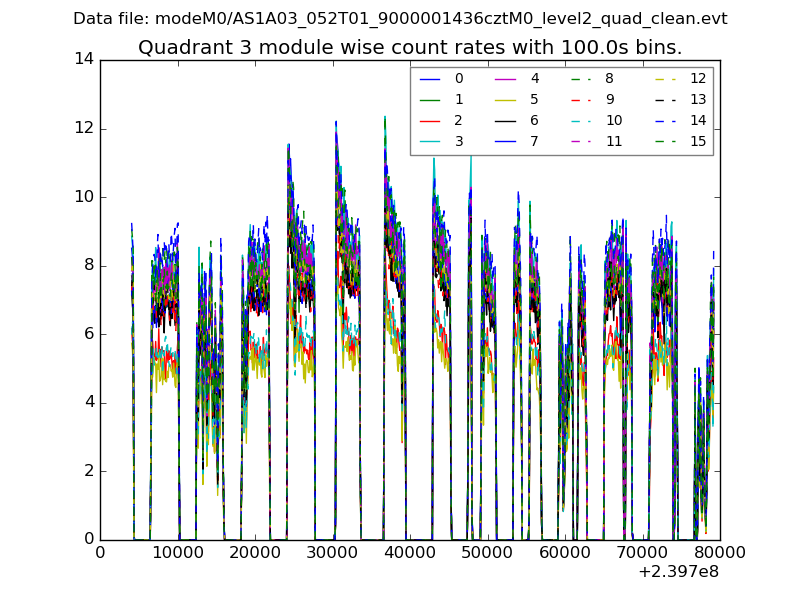
| Module-wise count rates for Quadrant C Data is divided into 100 sec bins |
 |
 |
| Module-wise count rates for Quadrant D Data is divided into 100 sec bins |
 |
 |
| Parameter | Plot |
|---|---|
| CZT HV Monitor |  |
| D_VDD | 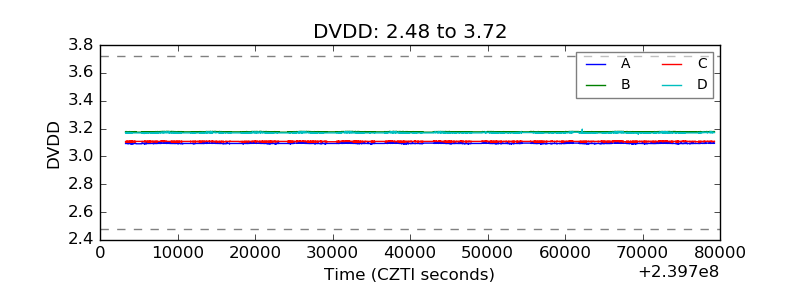 |
| Temperature 1 |  |
| Veto HV Monitor |  |
| Veto LLD |  |
| Alpha Counter |  |
| _CPM_Rate |  |
| CZT Counter |  |
| +2.5 Volts monitor |  |
| +5 Volts monitor | 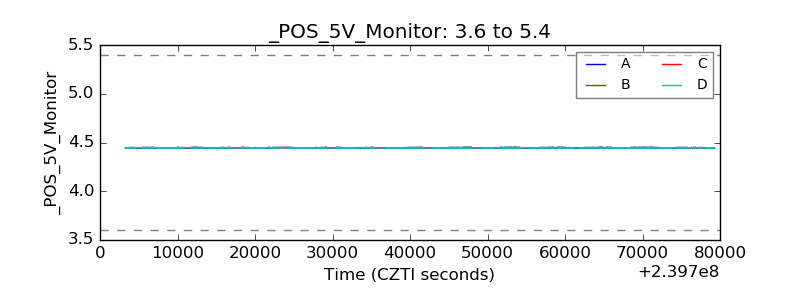 |
| _ROLL_ROT |  |
| _Roll_DEC |  |
| _Roll_RA | 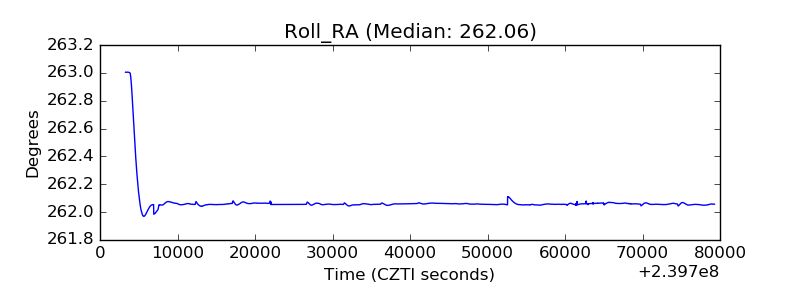 |
| Veto Counter |  |