| Param | Original file | Final file |
|---|---|---|
| Filename | modeM0/AS1G07_022T02_9000001434cztM0_level2.evt | modeM0/AS1G07_022T02_9000001434cztM0_level2_quad_clean.evt |
| Size (bytes) | 7,723,160,640 | 1,539,296,640 |
| Size | 7.2 GB | 1.4 GB |
| Events in quadrant A | 63,356,101 | 11,427,934 |
| Events in quadrant B | 68,631,189 | 11,573,888 |
| Events in quadrant C | 59,430,534 | 11,714,319 |
| Events in quadrant D | 34,781,092 | 4,094,555 |
| Mode M9 | |||
|---|---|---|---|
| Quadrant | BADHDUFLAG | Total packets | Discarded packets |
| A | 0 | 228 | 0 |
| B | 0 | 229 | 0 |
| C | 0 | 233 | 0 |
| D | 0 | 228 | 0 |
| Mode SS | |||
|---|---|---|---|
| Quadrant | BADHDUFLAG | Total packets | Discarded packets |
| A | 0 | 2743 | 0 |
| B | 0 | 2752 | 0 |
| C | 0 | 2721 | 0 |
| D | 0 | 2734 | 0 |
| Mode M0 | |||
|---|---|---|---|
| Quadrant | BADHDUFLAG | Total packets | Discarded packets |
| A | 0 | 281226 | 0 |
| B | 0 | 295294 | 0 |
| C | 0 | 273337 | 0 |
| D | 0 | 136425 | 0 |
| Quadrant | Total seconds | Saturated seconds | Saturation percentage |
|---|---|---|---|
| A | 133666 | 1364 | 1.020454% |
| B | 133782 | 2790 | 2.085482% |
| C | 133815 | 827 | 0.618017% |
| D | 49035 | 2237 | 4.562048% |
Noise dominated data is calculated using 1-second bins in cleaned event files. If a bin has >2000 counts, and if more than 50% of those come from <1% of pixels, then it is considered to be noise-dominated and hence unusable.
| Quadrant | # 1 sec bins | Bins with >0 counts | Bins with >2000 counts | High rate bins dominated by noise | Noise dominated (total time) | Noise dominated (detector-on time) | Marked lightcurve |
|---|---|---|---|---|---|---|---|
| A | 167437 | 137175 | 179 | 179 | 0.11% | 0.13% |  |
| B | 167437 | 137251 | 1009 | 1009 | 0.60% | 0.74% | 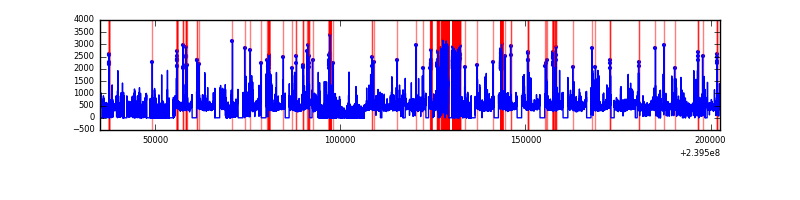 |
| C | 167437 | 137337 | 10 | 10 | 0.01% | 0.01% | 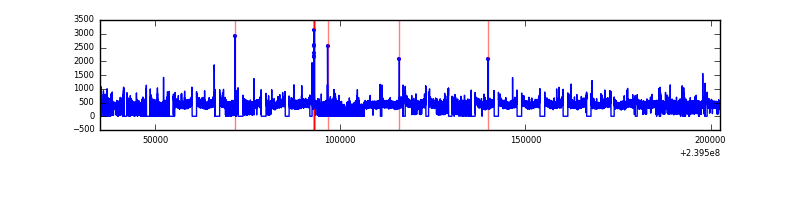 |
| D | 64907 | 51634 | 1920 | 1920 | 2.96% | 3.72% |  |
Top three noisy pixels from each quadrant. If the there are fewer than three noisy pixels in the level2.evt file, extra rows are filled as -1
| Pixel properties | Quadrant properties | ||||||
|---|---|---|---|---|---|---|---|
| Quadrant | DetID | PixID | Counts | Sigma | Mean | Median | Sigma |
| A | 8 | 15 | 2463525 | 789.81 | 15442 | 15107 | 3100.0 |
| A | 15 | 174 | 618948 | 194.79 | 15442 | 15107 | 3100.0 |
| A | 15 | 239 | 534292 | 167.48 | 15442 | 15107 | 3100.0 |
| B | 4 | 81 | 5378693 | 1833.31 | 15564 | 15198 | 2925.6 |
| B | 0 | 214 | 742123 | 248.47 | 15564 | 15198 | 2925.6 |
| B | 4 | 239 | 565323 | 188.04 | 15564 | 15198 | 2925.6 |
| C | 14 | 67 | 202339 | 53.7 | 15152 | 15220 | 3484.5 |
| C | 13 | 61 | 112805 | 28.01 | 15152 | 15220 | 3484.5 |
| C | 14 | 234 | 96672 | 23.38 | 15152 | 15220 | 3484.5 |
| D | 2 | 16 | 4486467 | 3339.57 | 5459 | 5321 | 1341.8 |
| D | 8 | 195 | 3098280 | 2305.02 | 5459 | 5321 | 1341.8 |
| D | 10 | 118 | 1542016 | 1145.22 | 5459 | 5321 | 1341.8 |
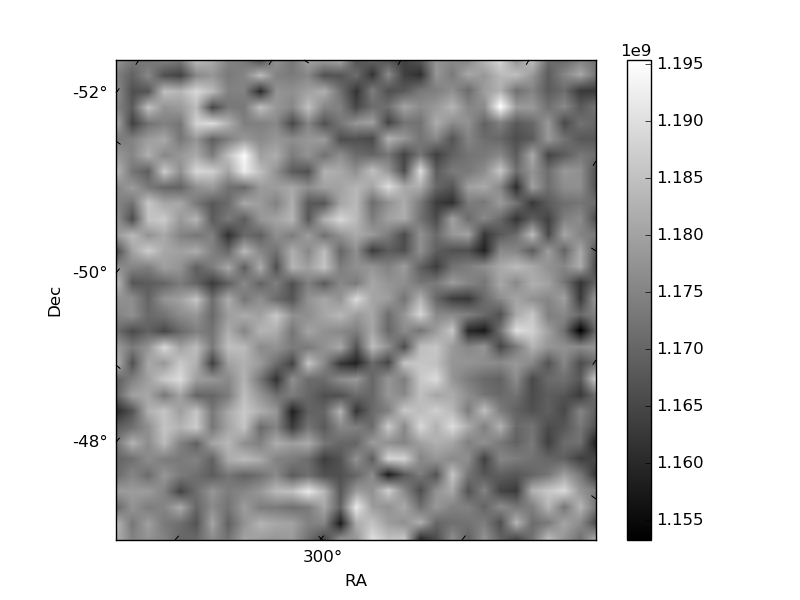
Histogram calculated using DETX and DETY for each event in the final _common_clean file
| Quadrant A |  |
 |
Quadrant B |
|---|---|---|---|
| Quadrant D |  |
 |
Quadrant C |
| Plot type | Count rate plots | Images |
|---|---|---|
| Comparison with Poisson distribution Blue bars denote a histogram of data divided into 1 sec bins. Red curve is a Poisson curve with rate = median count rate of data. |
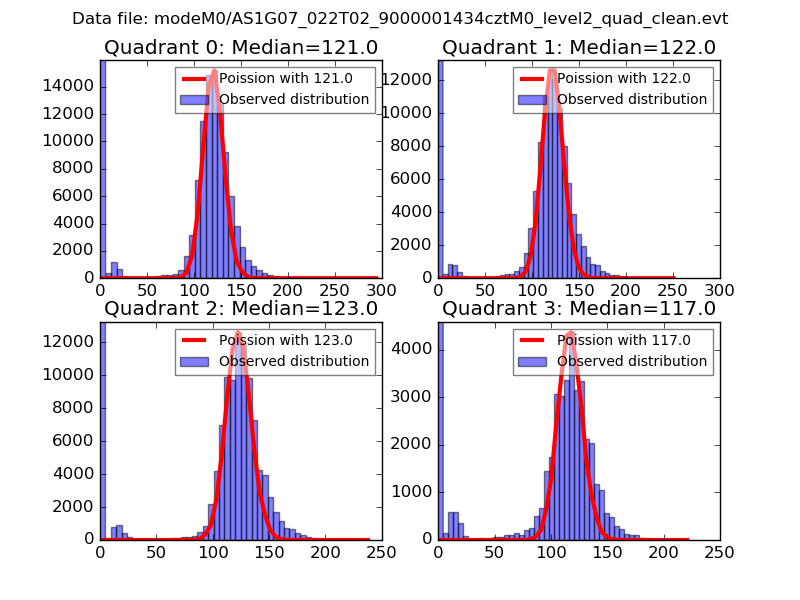 |
 |
| Quadrant-wise count rates Data is divided into 100 sec bins |
 |
|
| Module-wise count rates for Quadrant A Data is divided into 100 sec bins |
 |
 |
| Module-wise count rates for Quadrant B Data is divided into 100 sec bins |
 |
 |
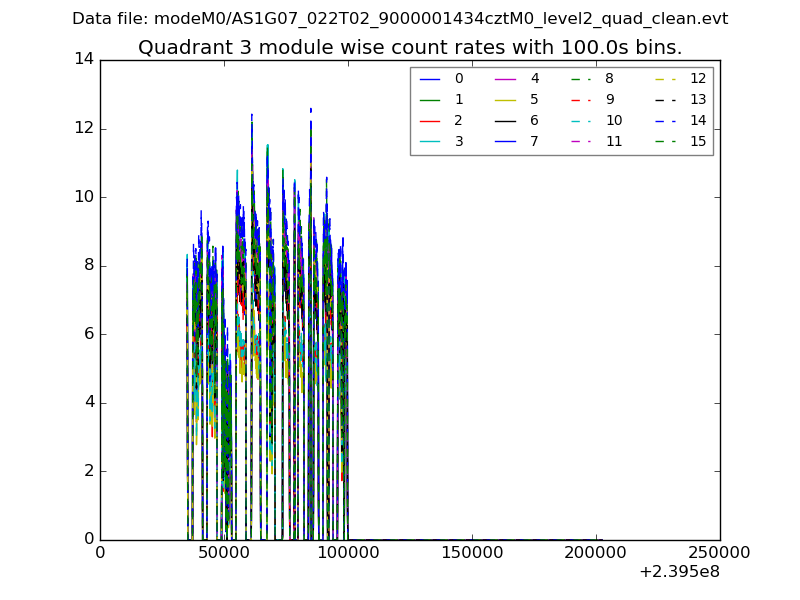
| Module-wise count rates for Quadrant C Data is divided into 100 sec bins |
 |
 |
| Module-wise count rates for Quadrant D Data is divided into 100 sec bins |
 |
 |
| Parameter | Plot |
|---|---|
| CZT HV Monitor |  |
| D_VDD | 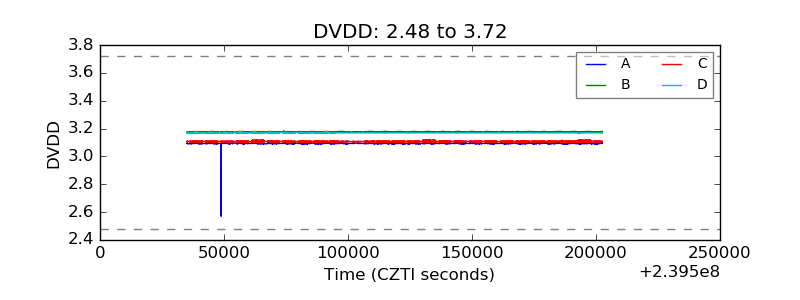 |
| Temperature 1 |  |
| Veto HV Monitor |  |
| Veto LLD |  |
| Alpha Counter |  |
| _CPM_Rate |  |
| CZT Counter |  |
| +2.5 Volts monitor |  |
| +5 Volts monitor | 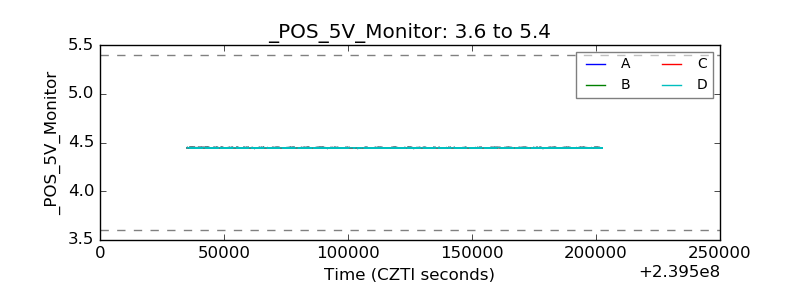 |
| _ROLL_ROT |  |
| _Roll_DEC |  |
| _Roll_RA |  |
| Veto Counter |  |