| Param | Original file | Final file |
|---|---|---|
| Filename | modeM0/AS1G07_005T01_9000001430cztM0_level2.evt | modeM0/AS1G07_005T01_9000001430cztM0_level2_quad_clean.evt |
| Size (bytes) | 1,409,423,040 | 225,783,360 |
| Size | 1.3 GB | 215.3 MB |
| Events in quadrant A | 9,756,541 | 1,381,817 |
| Events in quadrant B | 10,264,906 | 1,422,473 |
| Events in quadrant C | 8,693,604 | 1,373,683 |
| Events in quadrant D | 12,657,446 | 1,322,479 |
| Mode M0 | |||
|---|---|---|---|
| Quadrant | BADHDUFLAG | Total packets | Discarded packets |
| A | 0 | 42045 | 0 |
| B | 0 | 43493 | 0 |
| C | 0 | 39553 | 0 |
| D | 0 | 50718 | 0 |
| Mode M9 | |||
|---|---|---|---|
| Quadrant | BADHDUFLAG | Total packets | Discarded packets |
| A | 0 | 34 | 0 |
| B | 0 | 34 | 0 |
| C | 0 | 34 | 0 |
| D | 0 | 34 | 0 |
| Mode SS | |||
|---|---|---|---|
| Quadrant | BADHDUFLAG | Total packets | Discarded packets |
| A | 0 | 396 | 0 |
| B | 0 | 396 | 0 |
| C | 0 | 396 | 0 |
| D | 0 | 396 | 0 |
| Quadrant | Total seconds | Saturated seconds | Saturation percentage |
|---|---|---|---|
| A | 19426 | 230 | 1.183980% |
| B | 19418 | 497 | 2.559481% |
| C | 19425 | 149 | 0.767053% |
| D | 19404 | 720 | 3.710575% |
Noise dominated data is calculated using 1-second bins in cleaned event files. If a bin has >2000 counts, and if more than 50% of those come from <1% of pixels, then it is considered to be noise-dominated and hence unusable.
| Quadrant | # 1 sec bins | Bins with >0 counts | Bins with >2000 counts | High rate bins dominated by noise | Noise dominated (total time) | Noise dominated (detector-on time) | Marked lightcurve |
|---|---|---|---|---|---|---|---|
| A | 22788 | 19447 | 7 | 7 | 0.03% | 0.04% |  |
| B | 22788 | 19440 | 206 | 206 | 0.90% | 1.06% |  |
| C | 22788 | 19447 | 0 | 0 | 0.00% | 0.00% |  |
| D | 22787 | 19430 | 497 | 497 | 2.18% | 2.56% |  |
Top three noisy pixels from each quadrant. If the there are fewer than three noisy pixels in the level2.evt file, extra rows are filled as -1
| Pixel properties | Quadrant properties | ||||||
|---|---|---|---|---|---|---|---|
| Quadrant | DetID | PixID | Counts | Sigma | Mean | Median | Sigma |
| A | 8 | 15 | 910045 | 1961.53 | 2279 | 2223 | 462.8 |
| A | 15 | 174 | 38531 | 78.45 | 2279 | 2223 | 462.8 |
| A | 14 | 111 | 27943 | 55.57 | 2279 | 2223 | 462.8 |
| B | 4 | 239 | 917318 | 2109.58 | 2278 | 2220 | 433.8 |
| B | 0 | 214 | 96213 | 216.68 | 2278 | 2220 | 433.8 |
| B | 10 | 247 | 90437 | 203.37 | 2278 | 2220 | 433.8 |
| C | 13 | 61 | 16788 | 28.25 | 2227 | 2238 | 515.0 |
| C | 8 | 222 | 8758 | 12.66 | 2227 | 2238 | 515.0 |
| C | 14 | 67 | 6662 | 8.59 | 2227 | 2238 | 515.0 |
| D | 12 | 233 | 1410247 | 2520.2 | 2191 | 2133 | 558.7 |
| D | 1 | 52 | 1001162 | 1788.03 | 2191 | 2133 | 558.7 |
| D | 8 | 195 | 867445 | 1548.71 | 2191 | 2133 | 558.7 |
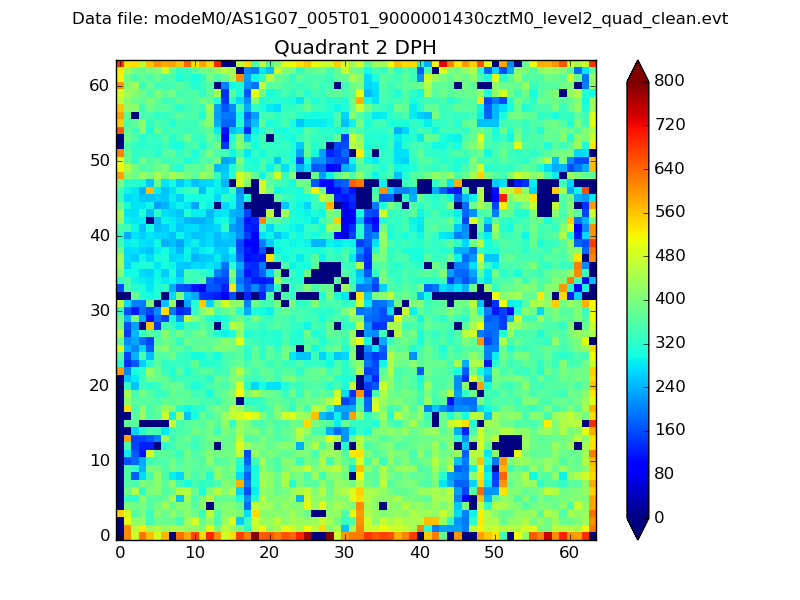
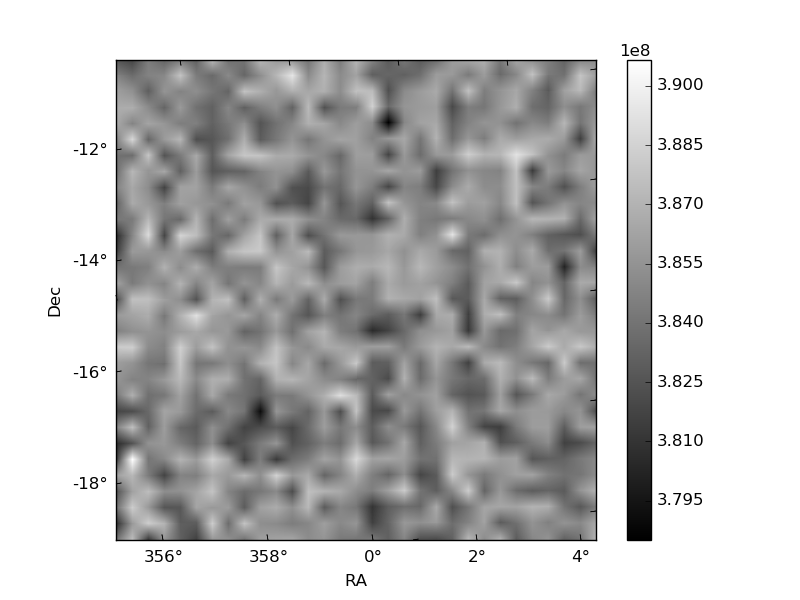
Histogram calculated using DETX and DETY for each event in the final _common_clean file
| Quadrant A |  |
 |
Quadrant B |
|---|---|---|---|
| Quadrant D |  |
 |
Quadrant C |
| Plot type | Count rate plots | Images |
|---|---|---|
| Comparison with Poisson distribution Blue bars denote a histogram of data divided into 1 sec bins. Red curve is a Poisson curve with rate = median count rate of data. |
 |
 |
| Quadrant-wise count rates Data is divided into 100 sec bins |
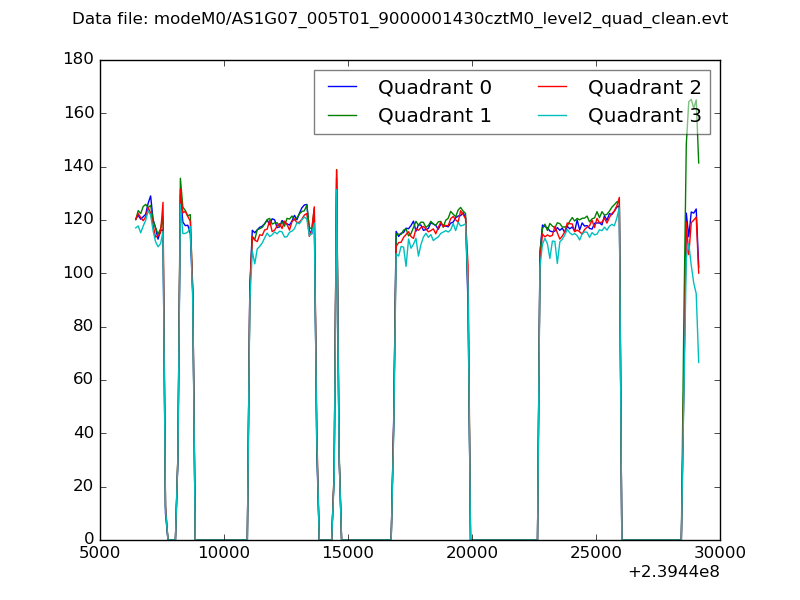 |
|
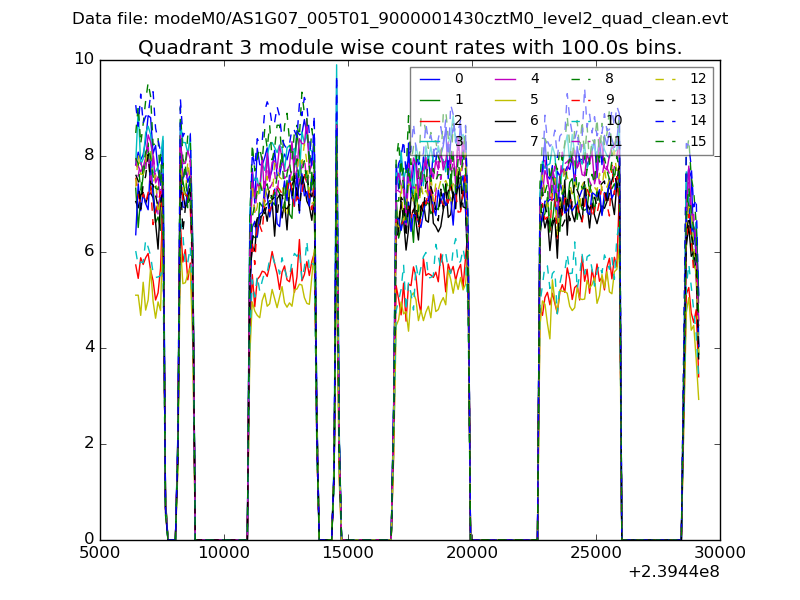
| Module-wise count rates for Quadrant A Data is divided into 100 sec bins |
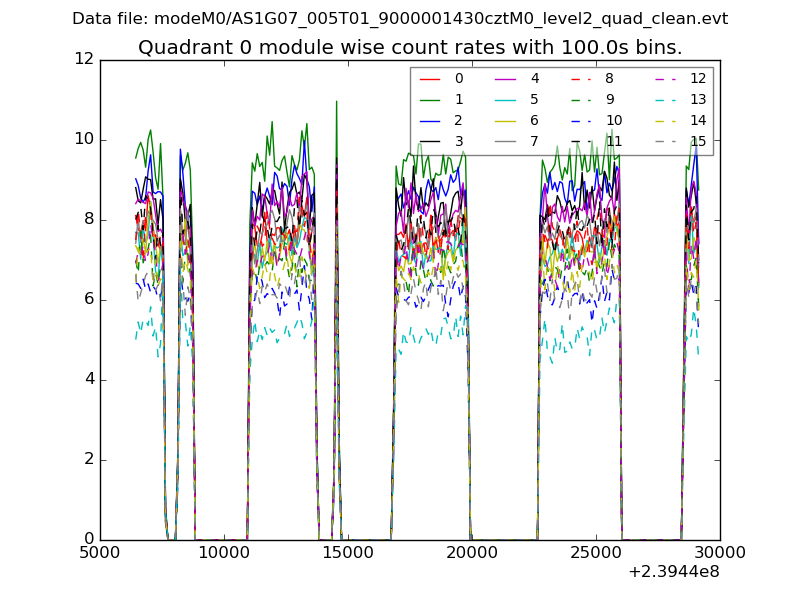 |
 |
| Module-wise count rates for Quadrant B Data is divided into 100 sec bins |
 |
 |
| Module-wise count rates for Quadrant C Data is divided into 100 sec bins |
 |
 |
| Module-wise count rates for Quadrant D Data is divided into 100 sec bins |
 |
 |
| Parameter | Plot |
|---|---|
| CZT HV Monitor |  |
| D_VDD |  |
| Temperature 1 |  |
| Veto HV Monitor |  |
| Veto LLD |  |
| Alpha Counter |  |
| _CPM_Rate | 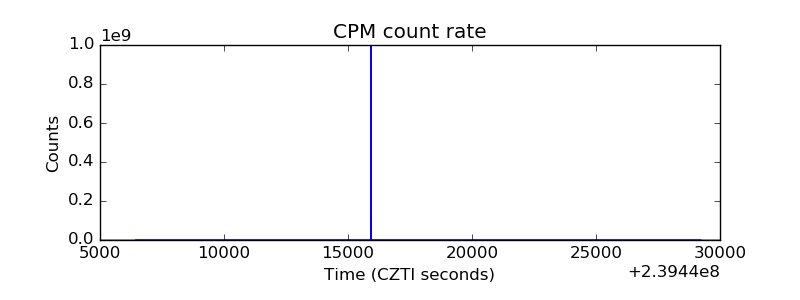 |
| CZT Counter |  |
| +2.5 Volts monitor |  |
| +5 Volts monitor |  |
| _ROLL_ROT |  |
| _Roll_DEC |  |
| _Roll_RA |  |
| Veto Counter |  |