| Param | Original file | Final file |
|---|---|---|
| Filename | modeM0/AS1G07_002T02_9000001432cztM0_level2_bc.evt | modeM0/AS1G07_002T02_9000001432cztM0_level2_quad_clean.evt |
| Size (bytes) | 2,022,770,880 | 697,138,560 |
| Size | 1.9 GB | 664.8 MB |
| Events in quadrant A | 12,454,844 | 4,395,120 |
| Events in quadrant B | 11,341,350 | 4,493,294 |
| Events in quadrant C | 10,257,799 | 4,338,999 |
| Events in quadrant D | 23,510,961 | 4,170,131 |
| Mode SS | |||
|---|---|---|---|
| Quadrant | BADHDUFLAG | Total packets | Discarded packets |
| A | 0 | 1102 | 0 |
| B | 0 | 1112 | 0 |
| C | 0 | 1112 | 0 |
| D | 0 | 1102 | 0 |
| Mode M0 | |||
|---|---|---|---|
| Quadrant | BADHDUFLAG | Total packets | Discarded packets |
| A | 0 | 116478 | 0 |
| B | 0 | 114306 | 0 |
| C | 0 | 111395 | 0 |
| D | 0 | 151204 | 0 |
| Mode M9 | |||
|---|---|---|---|
| Quadrant | BADHDUFLAG | Total packets | Discarded packets |
| A | 0 | 84 | 0 |
| B | 0 | 83 | 0 |
| C | 0 | 86 | 0 |
| D | 0 | 86 | 0 |
| Quadrant | Total seconds | Saturated seconds | Saturation percentage |
|---|---|---|---|
| A | 54219 | 723 | 1.333481% |
| B | 54209 | 764 | 1.409360% |
| C | 54178 | 407 | 0.751227% |
| D | 54058 | 2493 | 4.611713% |
Noise dominated data is calculated using 1-second bins in cleaned event files. If a bin has >2000 counts, and if more than 50% of those come from <1% of pixels, then it is considered to be noise-dominated and hence unusable.
| Quadrant | # 1 sec bins | Bins with >0 counts | Bins with >2000 counts | High rate bins dominated by noise | Noise dominated (total time) | Noise dominated (detector-on time) | Marked lightcurve |
|---|---|---|---|---|---|---|---|
| A | 63755 | 54807 | 28 | 28 | 0.04% | 0.05% |  |
| B | 63755 | 54783 | 4 | 4 | 0.01% | 0.01% |  |
| C | 63755 | 54812 | 0 | 0 | 0.00% | 0.00% |  |
| D | 63755 | 54713 | 237 | 237 | 0.37% | 0.43% |  |
Top three noisy pixels from each quadrant. If the there are fewer than three noisy pixels in the level2.evt file, extra rows are filled as -1
| Pixel properties | Quadrant properties | ||||||
|---|---|---|---|---|---|---|---|
| Quadrant | DetID | PixID | Counts | Sigma | Mean | Median | Sigma |
| A | 8 | 15 | 1730751 | 2922.73 | 2712 | 2656 | 591.3 |
| A | 14 | 111 | 204340 | 341.11 | 2712 | 2656 | 591.3 |
| A | 13 | 14 | 42750 | 67.81 | 2712 | 2656 | 591.3 |
| B | 0 | 219 | 164342 | 310.77 | 2758 | 2682 | 520.2 |
| B | 0 | 214 | 115971 | 217.78 | 2758 | 2682 | 520.2 |
| B | 4 | 81 | 113083 | 212.23 | 2758 | 2682 | 520.2 |
| C | 5 | 128 | 21180 | 33.93 | 2612 | 2583 | 548.0 |
| C | 13 | 61 | 15278 | 23.16 | 2612 | 2583 | 548.0 |
| C | 14 | 67 | 15150 | 22.93 | 2612 | 2583 | 548.0 |
| D | 8 | 195 | 4316835 | 6946.98 | 2624 | 2536 | 621.0 |
| D | 1 | 52 | 3635891 | 5850.51 | 2624 | 2536 | 621.0 |
| D | 12 | 233 | 1936892 | 3114.74 | 2624 | 2536 | 621.0 |
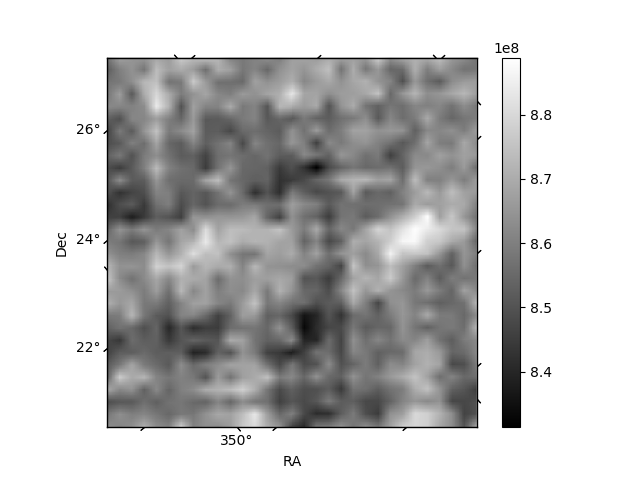
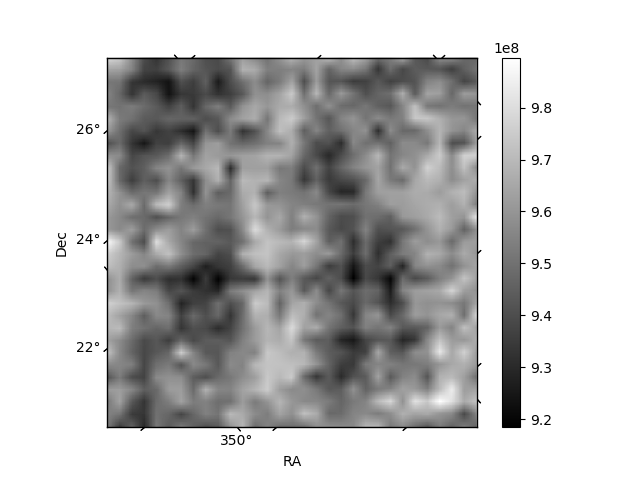
Histogram calculated using DETX and DETY for each event in the final _common_clean file
| Quadrant A |  |
 |
Quadrant B |
|---|---|---|---|
| Quadrant D |  |
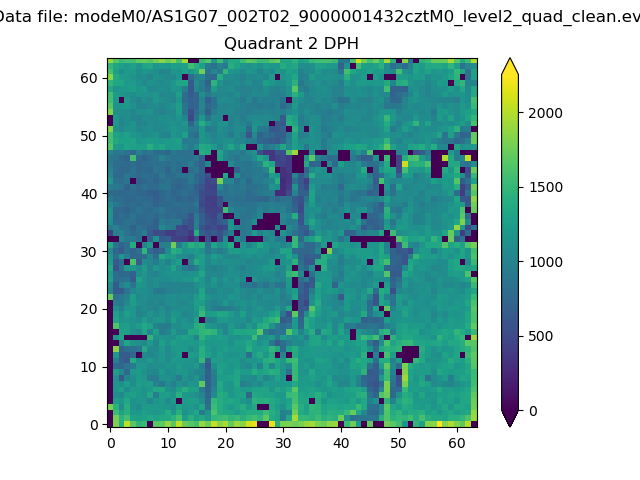 |
Quadrant C |
| Plot type | Count rate plots | Images |
|---|---|---|
| Comparison with Poisson distribution Blue bars denote a histogram of data divided into 1 sec bins. Red curve is a Poisson curve with rate = median count rate of data. |
 |
 |
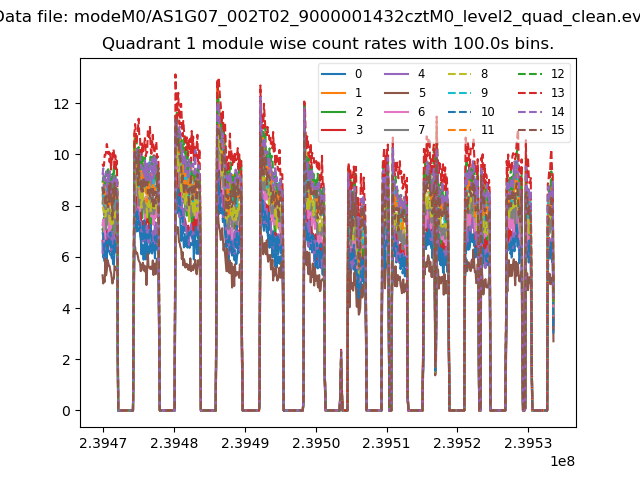
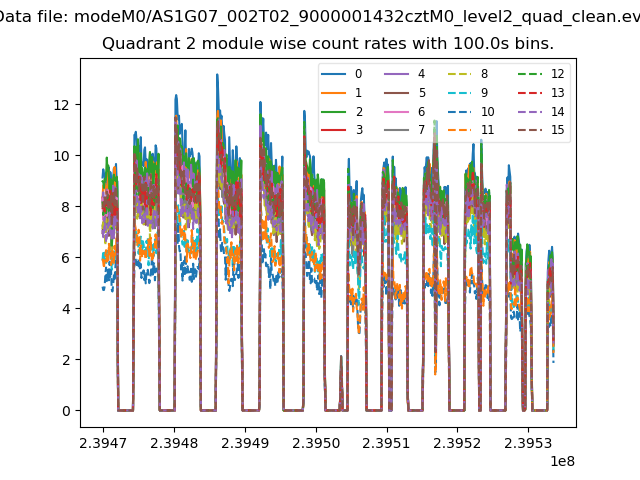
| Quadrant-wise count rates Data is divided into 100 sec bins |
 |
|
| Module-wise count rates for Quadrant A Data is divided into 100 sec bins |
 |
 |
| Module-wise count rates for Quadrant B Data is divided into 100 sec bins |
 |
 |
| Module-wise count rates for Quadrant C Data is divided into 100 sec bins |
 |
 |
| Module-wise count rates for Quadrant D Data is divided into 100 sec bins |
 |
 |
| Parameter | Plot |
|---|---|
| CZT HV Monitor | 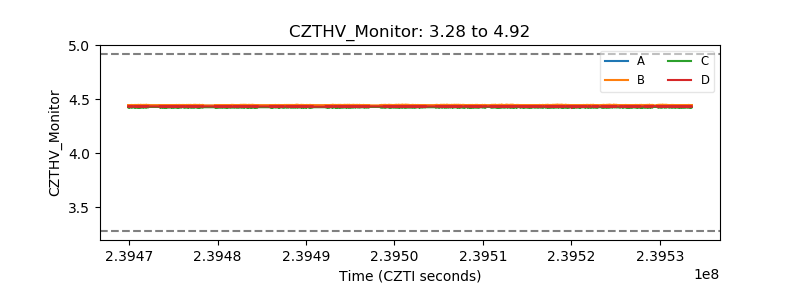 |
| D_VDD |  |
| Temperature 1 |  |
| Veto HV Monitor | 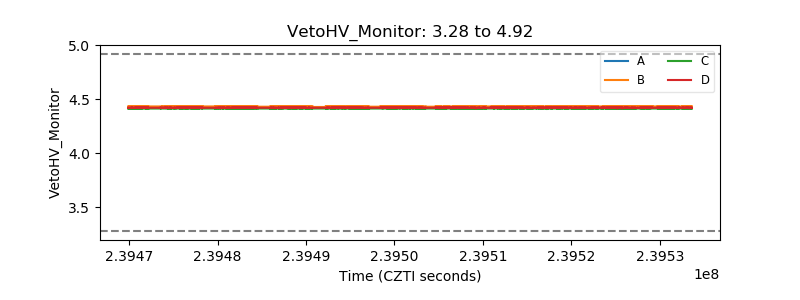 |
| Veto LLD | 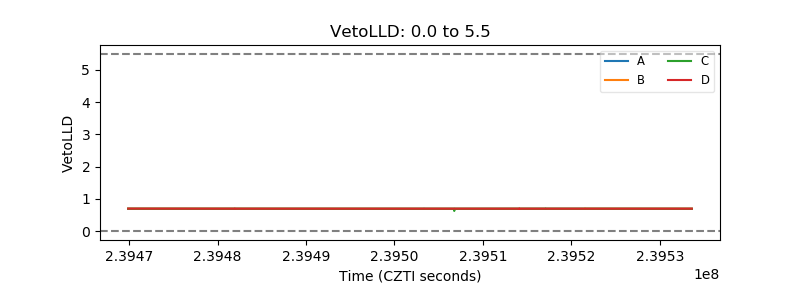 |
| Alpha Counter |  |
| _CPM_Rate |  |
| CZT Counter |  |
| +2.5 Volts monitor | 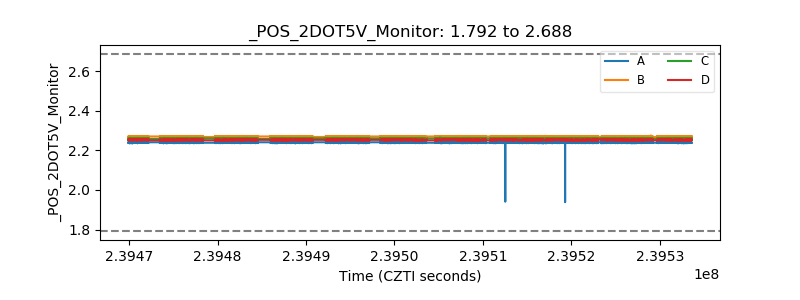 |
| +5 Volts monitor | 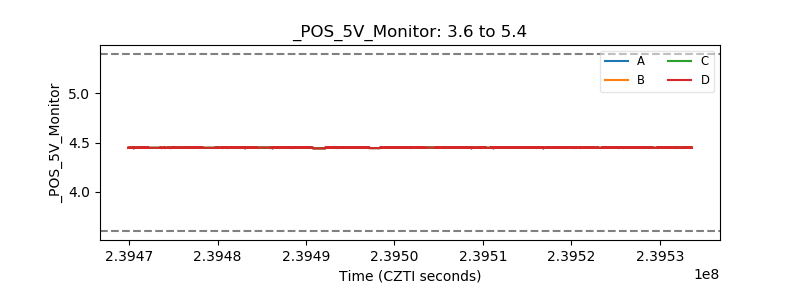 |
| _ROLL_ROT |  |
| _Roll_DEC |  |
| _Roll_RA |  |
| Veto Counter | 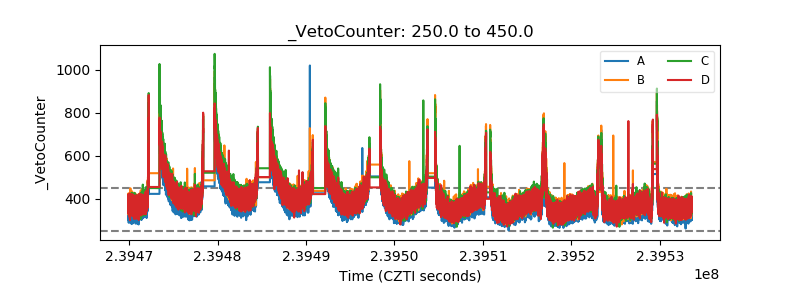 |