| Param | Original file | Final file |
|---|---|---|
| Filename | modeM0/AS1C02_028T02_9000001428cztM0_level2.evt | modeM0/AS1C02_028T02_9000001428cztM0_level2_quad_clean.evt |
| Size (bytes) | 1,227,614,400 | 217,615,680 |
| Size | 1.1 GB | 207.5 MB |
| Events in quadrant A | 8,551,898 | 1,343,954 |
| Events in quadrant B | 9,051,681 | 1,363,383 |
| Events in quadrant C | 8,073,904 | 1,346,698 |
| Events in quadrant D | 10,287,705 | 1,300,681 |
| Mode SS | |||
|---|---|---|---|
| Quadrant | BADHDUFLAG | Total packets | Discarded packets |
| A | 0 | 366 | 0 |
| B | 0 | 366 | 0 |
| C | 0 | 366 | 0 |
| D | 0 | 366 | 0 |
| Mode M0 | |||
|---|---|---|---|
| Quadrant | BADHDUFLAG | Total packets | Discarded packets |
| A | 0 | 37589 | 0 |
| B | 0 | 38840 | 0 |
| C | 0 | 36805 | 0 |
| D | 0 | 42393 | 0 |
| Mode M9 | |||
|---|---|---|---|
| Quadrant | BADHDUFLAG | Total packets | Discarded packets |
| A | 0 | 6 | 0 |
| B | 0 | 6 | 0 |
| C | 0 | 6 | 0 |
| D | 0 | 6 | 0 |
| Quadrant | Total seconds | Saturated seconds | Saturation percentage |
|---|---|---|---|
| A | 17923 | 616 | 3.436925% |
| B | 17921 | 606 | 3.381508% |
| C | 17921 | 428 | 2.388260% |
| D | 17922 | 695 | 3.877915% |
Noise dominated data is calculated using 1-second bins in cleaned event files. If a bin has >2000 counts, and if more than 50% of those come from <1% of pixels, then it is considered to be noise-dominated and hence unusable.
| Quadrant | # 1 sec bins | Bins with >0 counts | Bins with >2000 counts | High rate bins dominated by noise | Noise dominated (total time) | Noise dominated (detector-on time) | Marked lightcurve |
|---|---|---|---|---|---|---|---|
| A | 18556 | 17926 | 56 | 56 | 0.30% | 0.31% |  |
| B | 18556 | 17925 | 46 | 46 | 0.25% | 0.26% |  |
| C | 18556 | 17925 | 1 | 1 | 0.01% | 0.01% |  |
| D | 18556 | 17925 | 203 | 203 | 1.09% | 1.13% |  |
Top three noisy pixels from each quadrant. If the there are fewer than three noisy pixels in the level2.evt file, extra rows are filled as -1
| Pixel properties | Quadrant properties | ||||||
|---|---|---|---|---|---|---|---|
| Quadrant | DetID | PixID | Counts | Sigma | Mean | Median | Sigma |
| A | 15 | 174 | 246953 | 570.64 | 2095 | 2045 | 429.2 |
| A | 8 | 15 | 233128 | 538.43 | 2095 | 2045 | 429.2 |
| A | 0 | 226 | 19141 | 39.83 | 2095 | 2045 | 429.2 |
| B | 4 | 239 | 234959 | 575.41 | 2102 | 2042 | 404.8 |
| B | 4 | 81 | 229413 | 561.71 | 2102 | 2042 | 404.8 |
| B | 0 | 214 | 146768 | 357.54 | 2102 | 2042 | 404.8 |
| C | 8 | 128 | 24906 | 47.78 | 2054 | 2063 | 478.1 |
| C | 13 | 61 | 15160 | 27.4 | 2054 | 2063 | 478.1 |
| C | 8 | 112 | 13502 | 23.93 | 2054 | 2063 | 478.1 |
| D | 1 | 52 | 907479 | 1730.65 | 2037 | 1980 | 523.2 |
| D | 2 | 16 | 628768 | 1197.96 | 2037 | 1980 | 523.2 |
| D | 8 | 195 | 479181 | 912.06 | 2037 | 1980 | 523.2 |
Histogram calculated using DETX and DETY for each event in the final _common_clean file
| Quadrant A |  |
 |
Quadrant B |
|---|---|---|---|
| Quadrant D | 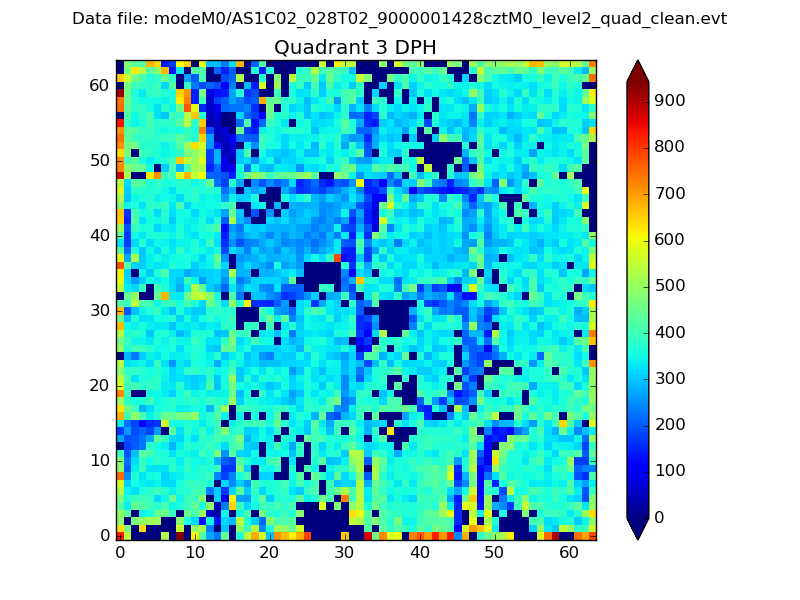 |
 |
Quadrant C |
| Plot type | Count rate plots | Images |
|---|---|---|
| Comparison with Poisson distribution Blue bars denote a histogram of data divided into 1 sec bins. Red curve is a Poisson curve with rate = median count rate of data. |
 |
 |
| Quadrant-wise count rates Data is divided into 100 sec bins |
 |
|
| Module-wise count rates for Quadrant A Data is divided into 100 sec bins |
 |
 |
| Module-wise count rates for Quadrant B Data is divided into 100 sec bins |
 |
 |
| Module-wise count rates for Quadrant C Data is divided into 100 sec bins |
 |
 |
| Module-wise count rates for Quadrant D Data is divided into 100 sec bins |
 |
 |
| Parameter | Plot |
|---|---|
| CZT HV Monitor |  |
| D_VDD |  |
| Temperature 1 | 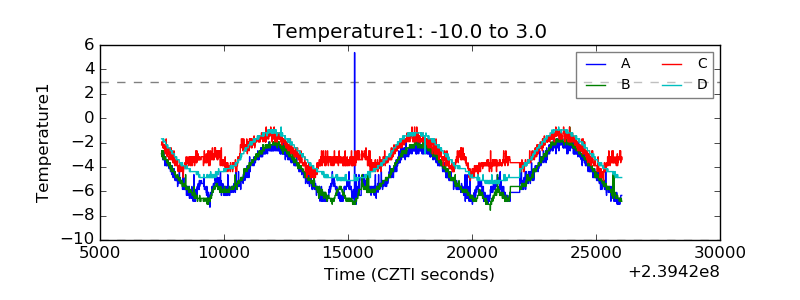 |
| Veto HV Monitor |  |
| Veto LLD |  |
| Alpha Counter |  |
| _CPM_Rate |  |
| CZT Counter |  |
| +2.5 Volts monitor |  |
| +5 Volts monitor |  |
| _ROLL_ROT |  |
| _Roll_DEC |  |
| _Roll_RA |  |
| Veto Counter |  |