| Param | Original file | Final file |
|---|---|---|
| Filename | modeM0/AS1G07_074T01_9000001426cztM0_level2.evt | modeM0/AS1G07_074T01_9000001426cztM0_level2_quad_clean.evt |
| Size (bytes) | 6,352,421,760 | 956,868,480 |
| Size | 5.9 GB | 912.5 MB |
| Events in quadrant A | 53,314,595 | 5,810,299 |
| Events in quadrant B | 41,846,329 | 6,099,803 |
| Events in quadrant C | 34,447,016 | 6,128,241 |
| Events in quadrant D | 57,551,925 | 5,625,255 |
| Mode SS | |||
|---|---|---|---|
| Quadrant | BADHDUFLAG | Total packets | Discarded packets |
| A | 0 | 1582 | 0 |
| B | 0 | 1594 | 0 |
| C | 0 | 1584 | 0 |
| D | 0 | 1586 | 0 |
| Mode M0 | |||
|---|---|---|---|
| Quadrant | BADHDUFLAG | Total packets | Discarded packets |
| A | 0 | 211315 | 0 |
| B | 0 | 176911 | 0 |
| C | 0 | 159053 | 0 |
| D | 0 | 224075 | 0 |
| Mode M9 | |||
|---|---|---|---|
| Quadrant | BADHDUFLAG | Total packets | Discarded packets |
| A | 0 | 127 | 0 |
| B | 0 | 126 | 0 |
| C | 0 | 127 | 0 |
| D | 0 | 127 | 0 |
| Quadrant | Total seconds | Saturated seconds | Saturation percentage |
|---|---|---|---|
| A | 77234 | 6448 | 8.348655% |
| B | 77668 | 1718 | 2.211979% |
| C | 77765 | 643 | 0.826850% |
| D | 77283 | 5332 | 6.899318% |
Noise dominated data is calculated using 1-second bins in cleaned event files. If a bin has >2000 counts, and if more than 50% of those come from <1% of pixels, then it is considered to be noise-dominated and hence unusable.
| Quadrant | # 1 sec bins | Bins with >0 counts | Bins with >2000 counts | High rate bins dominated by noise | Noise dominated (total time) | Noise dominated (detector-on time) | Marked lightcurve |
|---|---|---|---|---|---|---|---|
| A | 92741 | 78551 | 4496 | 4496 | 4.85% | 5.72% |  |
| B | 92741 | 79015 | 683 | 683 | 0.74% | 0.86% | 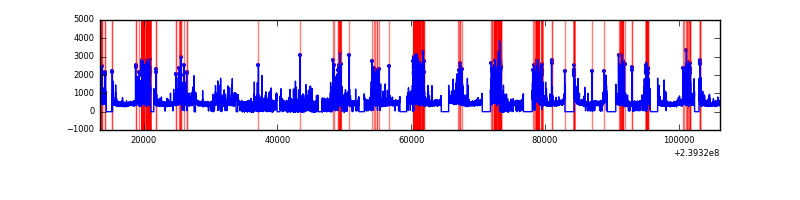 |
| C | 92741 | 79067 | 16 | 16 | 0.02% | 0.02% |  |
| D | 92741 | 78646 | 4583 | 4583 | 4.94% | 5.83% |  |
Top three noisy pixels from each quadrant. If the there are fewer than three noisy pixels in the level2.evt file, extra rows are filled as -1
| Pixel properties | Quadrant properties | ||||||
|---|---|---|---|---|---|---|---|
| Quadrant | DetID | PixID | Counts | Sigma | Mean | Median | Sigma |
| A | 13 | 251 | 16429382 | 9250.62 | 8767 | 8576 | 1775.1 |
| A | 14 | 111 | 1921418 | 1077.59 | 8767 | 8576 | 1775.1 |
| A | 15 | 174 | 718164 | 399.74 | 8767 | 8576 | 1775.1 |
| B | 0 | 85 | 2009378 | 1168.37 | 9064 | 8862 | 1712.2 |
| B | 4 | 239 | 1631732 | 947.81 | 9064 | 8862 | 1712.2 |
| B | 11 | 51 | 763640 | 440.82 | 9064 | 8862 | 1712.2 |
| C | 13 | 61 | 66179 | 28.39 | 8776 | 8806 | 2020.8 |
| C | 14 | 234 | 59136 | 24.91 | 8776 | 8806 | 2020.8 |
| C | 14 | 67 | 43533 | 17.19 | 8776 | 8806 | 2020.8 |
| D | 1 | 52 | 12992280 | 5937.22 | 8403 | 8182 | 2186.9 |
| D | 2 | 16 | 5616900 | 2564.69 | 8403 | 8182 | 2186.9 |
| D | 8 | 195 | 3146184 | 1434.91 | 8403 | 8182 | 2186.9 |
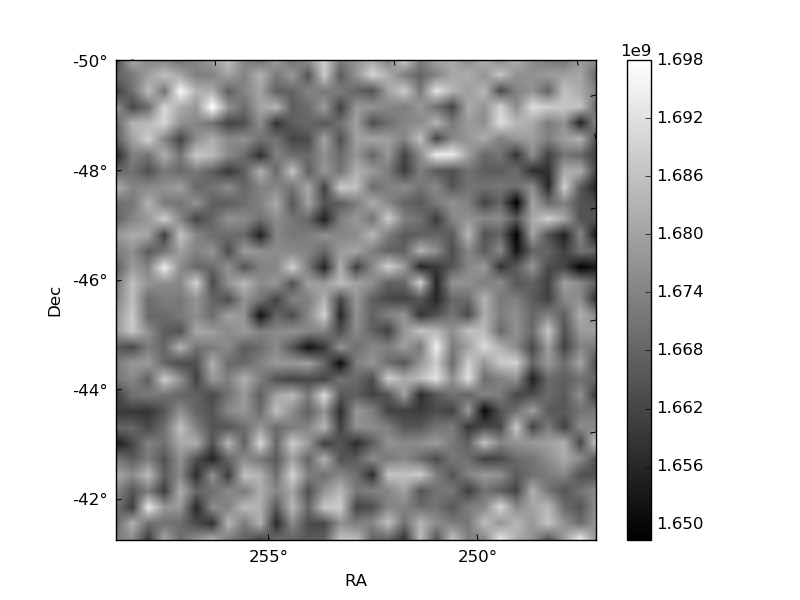
Histogram calculated using DETX and DETY for each event in the final _common_clean file
| Quadrant A |  |
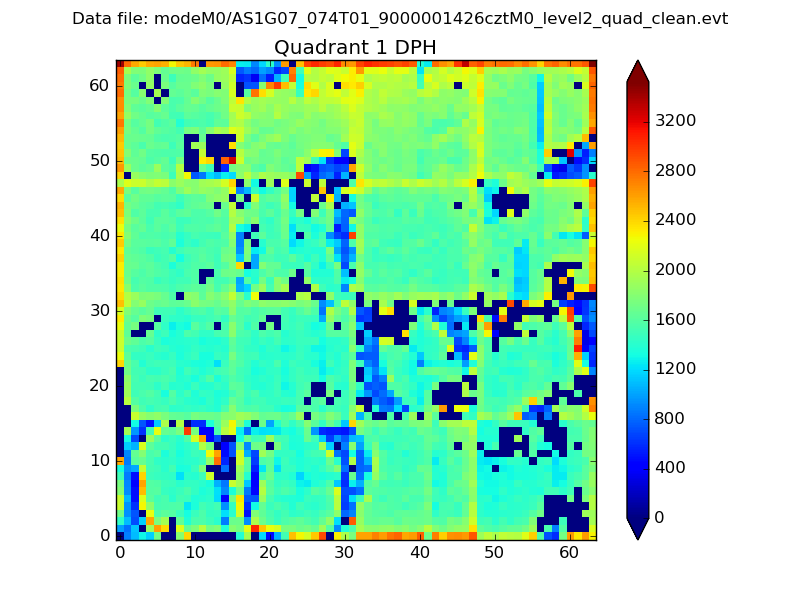 |
Quadrant B |
|---|---|---|---|
| Quadrant D |  |
 |
Quadrant C |
| Plot type | Count rate plots | Images |
|---|---|---|
| Comparison with Poisson distribution Blue bars denote a histogram of data divided into 1 sec bins. Red curve is a Poisson curve with rate = median count rate of data. |
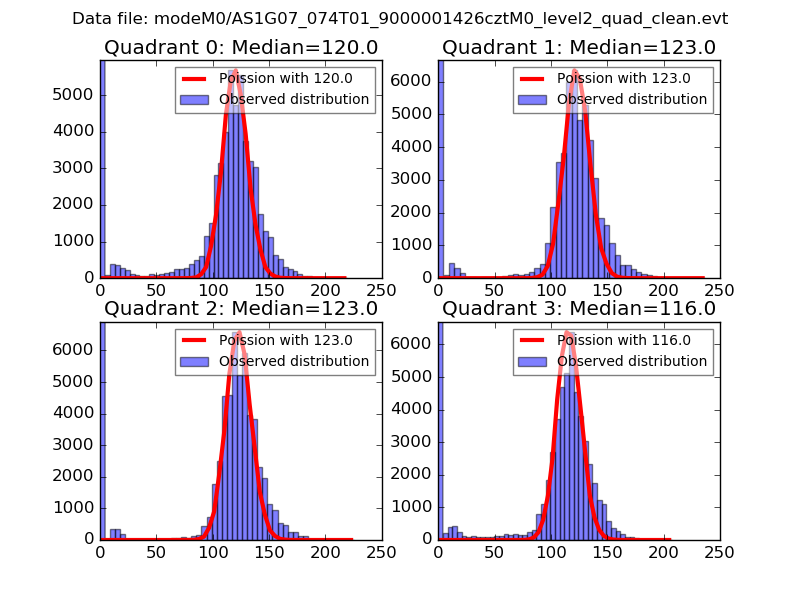 |
 |
| Quadrant-wise count rates Data is divided into 100 sec bins |
 |
|
| Module-wise count rates for Quadrant A Data is divided into 100 sec bins |
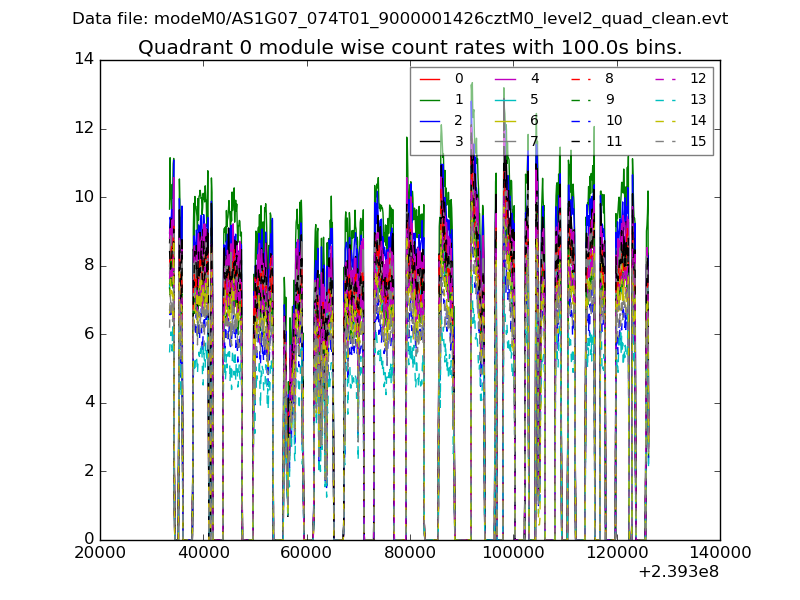 |
 |
| Module-wise count rates for Quadrant B Data is divided into 100 sec bins |
 |
 |
| Module-wise count rates for Quadrant C Data is divided into 100 sec bins |
 |
 |
| Module-wise count rates for Quadrant D Data is divided into 100 sec bins |
 |
 |
| Parameter | Plot |
|---|---|
| CZT HV Monitor |  |
| D_VDD |  |
| Temperature 1 | 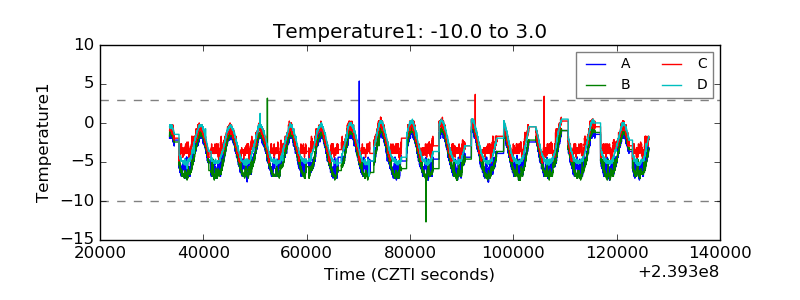 |
| Veto HV Monitor |  |
| Veto LLD |  |
| Alpha Counter |  |
| _CPM_Rate | 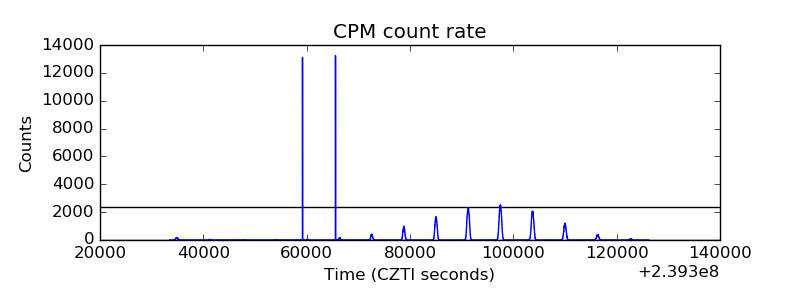 |
| CZT Counter |  |
| +2.5 Volts monitor |  |
| +5 Volts monitor |  |
| _ROLL_ROT |  |
| _Roll_DEC |  |
| _Roll_RA | 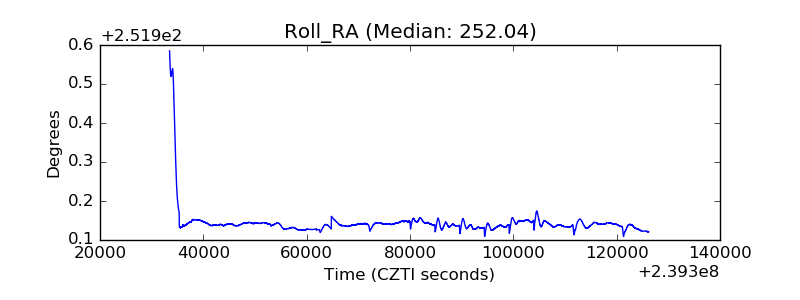 |
| Veto Counter |  |