| Param | Original file | Final file |
|---|---|---|
| Filename | modeM0/AS1G07_047T01_9000001424cztM0_level2.evt | modeM0/AS1G07_047T01_9000001424cztM0_level2_quad_clean.evt |
| Size (bytes) | 6,350,135,040 | 969,949,440 |
| Size | 5.9 GB | 925.0 MB |
| Events in quadrant A | 47,299,564 | 5,987,806 |
| Events in quadrant B | 40,939,359 | 6,182,961 |
| Events in quadrant C | 35,638,385 | 6,167,049 |
| Events in quadrant D | 63,083,652 | 5,591,516 |
| Mode M9 | |||
|---|---|---|---|
| Quadrant | BADHDUFLAG | Total packets | Discarded packets |
| A | 0 | 134 | 0 |
| B | 0 | 132 | 0 |
| C | 0 | 133 | 0 |
| D | 0 | 135 | 0 |
| Mode SS | |||
|---|---|---|---|
| Quadrant | BADHDUFLAG | Total packets | Discarded packets |
| A | 0 | 1619 | 0 |
| B | 0 | 1628 | 0 |
| C | 0 | 1627 | 0 |
| D | 0 | 1624 | 0 |
| Mode M0 | |||
|---|---|---|---|
| Quadrant | BADHDUFLAG | Total packets | Discarded packets |
| A | 0 | 195867 | 0 |
| B | 0 | 174542 | 0 |
| C | 0 | 162925 | 0 |
| D | 0 | 241086 | 0 |
| Quadrant | Total seconds | Saturated seconds | Saturation percentage |
|---|---|---|---|
| A | 79590 | 3793 | 4.765674% |
| B | 79546 | 1480 | 1.860559% |
| C | 79593 | 559 | 0.702323% |
| D | 78970 | 5294 | 6.703812% |
Noise dominated data is calculated using 1-second bins in cleaned event files. If a bin has >2000 counts, and if more than 50% of those come from <1% of pixels, then it is considered to be noise-dominated and hence unusable.
| Quadrant | # 1 sec bins | Bins with >0 counts | Bins with >2000 counts | High rate bins dominated by noise | Noise dominated (total time) | Noise dominated (detector-on time) | Marked lightcurve |
|---|---|---|---|---|---|---|---|
| A | 95570 | 80900 | 2785 | 2785 | 2.91% | 3.44% |  |
| B | 95570 | 80840 | 455 | 455 | 0.48% | 0.56% |  |
| C | 95570 | 80837 | 0 | 0 | 0.00% | 0.00% |  |
| D | 95570 | 80336 | 4399 | 4399 | 4.60% | 5.48% |  |
Top three noisy pixels from each quadrant. If the there are fewer than three noisy pixels in the level2.evt file, extra rows are filled as -1
| Pixel properties | Quadrant properties | ||||||
|---|---|---|---|---|---|---|---|
| Quadrant | DetID | PixID | Counts | Sigma | Mean | Median | Sigma |
| A | 13 | 251 | 10888508 | 5827.09 | 9247 | 9049 | 1867.0 |
| A | 15 | 174 | 665886 | 351.8 | 9247 | 9049 | 1867.0 |
| A | 8 | 15 | 89276 | 42.97 | 9247 | 9049 | 1867.0 |
| B | 4 | 81 | 1831904 | 1021.03 | 9444 | 9224 | 1785.1 |
| B | 4 | 239 | 514497 | 283.04 | 9444 | 9224 | 1785.1 |
| B | 0 | 214 | 495491 | 272.4 | 9444 | 9224 | 1785.1 |
| C | 13 | 61 | 68224 | 28.06 | 9117 | 9161 | 2105.1 |
| C | 14 | 67 | 44526 | 16.8 | 9117 | 9161 | 2105.1 |
| C | 8 | 222 | 40943 | 15.1 | 9117 | 9161 | 2105.1 |
| D | 1 | 52 | 17574587 | 7970.6 | 8691 | 8470 | 2203.9 |
| D | 2 | 16 | 3935708 | 1781.98 | 8691 | 8470 | 2203.9 |
| D | 8 | 195 | 2242003 | 1013.46 | 8691 | 8470 | 2203.9 |
Histogram calculated using DETX and DETY for each event in the final _common_clean file
| Quadrant A |  |
 |
Quadrant B |
|---|---|---|---|
| Quadrant D |  |
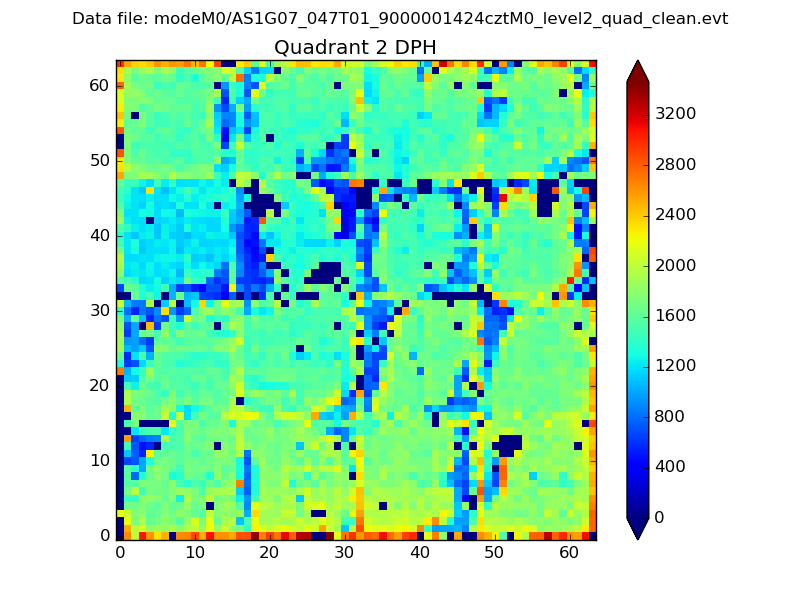 |
Quadrant C |
| Plot type | Count rate plots | Images |
|---|---|---|
| Comparison with Poisson distribution Blue bars denote a histogram of data divided into 1 sec bins. Red curve is a Poisson curve with rate = median count rate of data. |
 |
 |
| Quadrant-wise count rates Data is divided into 100 sec bins |
 |
|
| Module-wise count rates for Quadrant A Data is divided into 100 sec bins |
 |
 |
| Module-wise count rates for Quadrant B Data is divided into 100 sec bins |
 |
 |
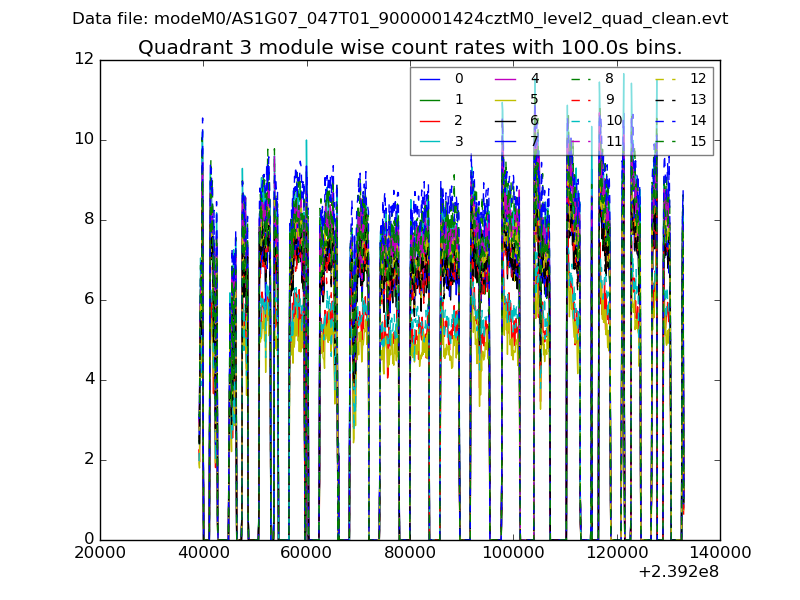
| Module-wise count rates for Quadrant C Data is divided into 100 sec bins |
 |
 |
| Module-wise count rates for Quadrant D Data is divided into 100 sec bins |
 |
 |
| Parameter | Plot |
|---|---|
| CZT HV Monitor | 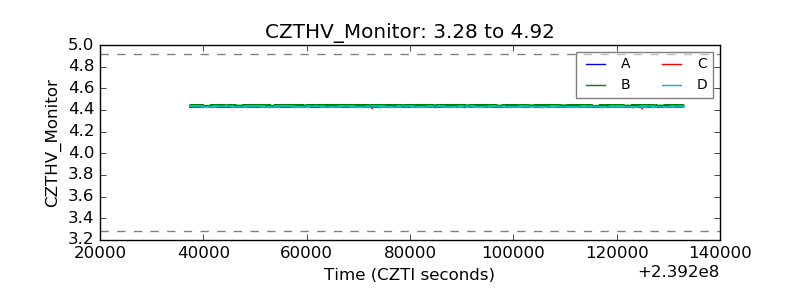 |
| D_VDD | 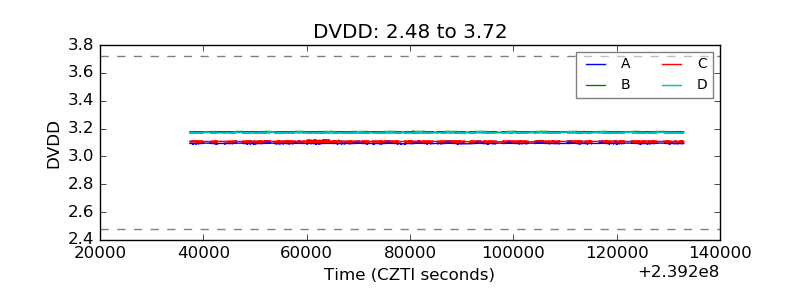 |
| Temperature 1 |  |
| Veto HV Monitor | 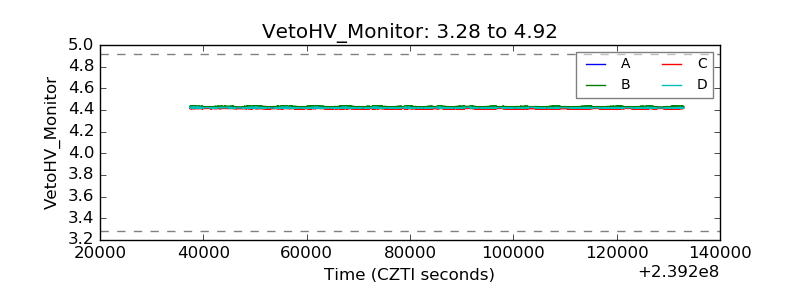 |
| Veto LLD | 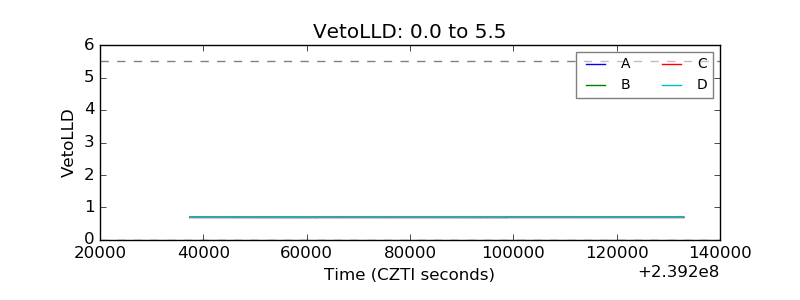 |
| Alpha Counter | 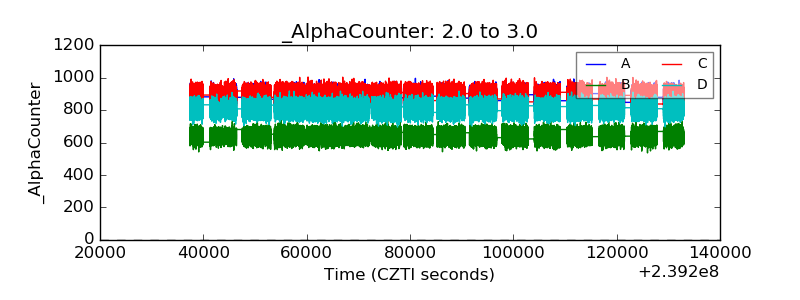 |
| _CPM_Rate |  |
| CZT Counter |  |
| +2.5 Volts monitor | 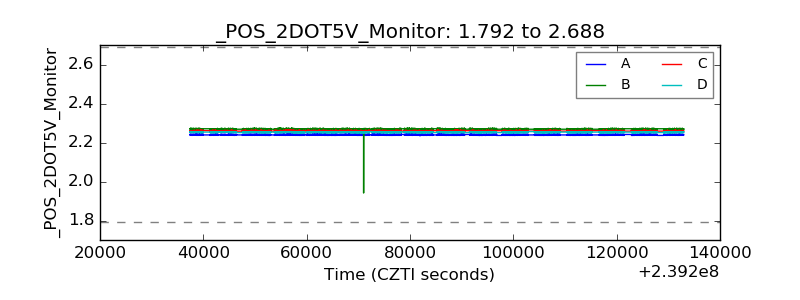 |
| +5 Volts monitor | 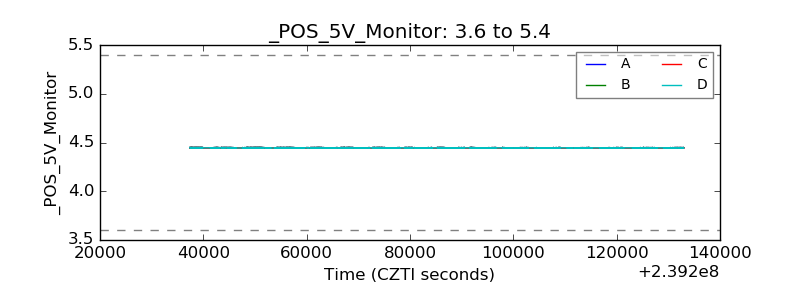 |
| _ROLL_ROT |  |
| _Roll_DEC |  |
| _Roll_RA |  |
| Veto Counter |  |