| Param | Original file | Final file |
|---|---|---|
| Filename | modeM0/AS1A03_008T02_9000001422cztM0_level2.evt | modeM0/AS1A03_008T02_9000001422cztM0_level2_quad_clean.evt |
| Size (bytes) | 933,667,200 | 202,034,880 |
| Size | 890.4 MB | 192.7 MB |
| Events in quadrant A | 5,829,126 | 1,324,641 |
| Events in quadrant B | 6,089,461 | 1,371,073 |
| Events in quadrant C | 5,678,608 | 1,352,856 |
| Events in quadrant D | 9,860,252 | 1,234,168 |
| Mode M9 | |||
|---|---|---|---|
| Quadrant | BADHDUFLAG | Total packets | Discarded packets |
| A | 0 | 39 | 0 |
| B | 0 | 39 | 0 |
| C | 0 | 38 | 0 |
| D | 0 | 39 | 0 |
| Mode M0 | |||
|---|---|---|---|
| Quadrant | BADHDUFLAG | Total packets | Discarded packets |
| A | 0 | 25758 | 0 |
| B | 0 | 26410 | 0 |
| C | 0 | 25398 | 0 |
| D | 0 | 37685 | 0 |
| Mode SS | |||
|---|---|---|---|
| Quadrant | BADHDUFLAG | Total packets | Discarded packets |
| A | 0 | 254 | 0 |
| B | 0 | 256 | 0 |
| C | 0 | 246 | 0 |
| D | 0 | 248 | 0 |
| Quadrant | Total seconds | Saturated seconds | Saturation percentage |
|---|---|---|---|
| A | 12104 | 164 | 1.354924% |
| B | 12141 | 186 | 1.531999% |
| C | 12142 | 123 | 1.013013% |
| D | 11942 | 587 | 4.915425% |
Noise dominated data is calculated using 1-second bins in cleaned event files. If a bin has >2000 counts, and if more than 50% of those come from <1% of pixels, then it is considered to be noise-dominated and hence unusable.
| Quadrant | # 1 sec bins | Bins with >0 counts | Bins with >2000 counts | High rate bins dominated by noise | Noise dominated (total time) | Noise dominated (detector-on time) | Marked lightcurve |
|---|---|---|---|---|---|---|---|
| A | 16474 | 12482 | 8 | 8 | 0.05% | 0.06% | 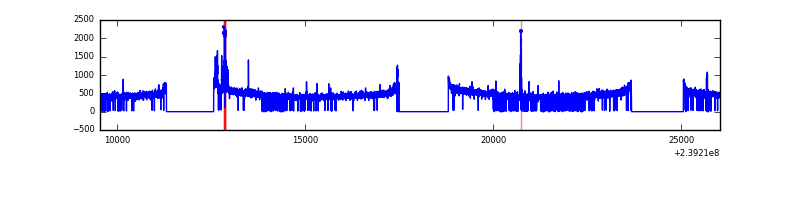 |
| B | 16474 | 12502 | 5 | 5 | 0.03% | 0.04% |  |
| C | 16474 | 12504 | 0 | 0 | 0.00% | 0.00% |  |
| D | 16474 | 12434 | 396 | 396 | 2.40% | 3.18% |  |
Top three noisy pixels from each quadrant. If the there are fewer than three noisy pixels in the level2.evt file, extra rows are filled as -1
| Pixel properties | Quadrant properties | ||||||
|---|---|---|---|---|---|---|---|
| Quadrant | DetID | PixID | Counts | Sigma | Mean | Median | Sigma |
| A | 14 | 254 | 114361 | 383.04 | 1465 | 1436 | 294.8 |
| A | 15 | 174 | 50494 | 166.4 | 1465 | 1436 | 294.8 |
| A | 8 | 15 | 23322 | 74.24 | 1465 | 1436 | 294.8 |
| B | 4 | 81 | 91827 | 324.46 | 1492 | 1460 | 278.5 |
| B | 4 | 239 | 57293 | 200.47 | 1492 | 1460 | 278.5 |
| B | 0 | 219 | 53526 | 186.94 | 1492 | 1460 | 278.5 |
| C | 13 | 61 | 10859 | 28.67 | 1451 | 1459 | 327.9 |
| C | 14 | 67 | 6561 | 15.56 | 1451 | 1459 | 327.9 |
| C | 12 | 4 | 6159 | 14.33 | 1451 | 1459 | 327.9 |
| D | 12 | 233 | 1395358 | 4004.97 | 1386 | 1350 | 348.1 |
| D | 1 | 52 | 1005753 | 2885.64 | 1386 | 1350 | 348.1 |
| D | 2 | 33 | 666221 | 1910.17 | 1386 | 1350 | 348.1 |
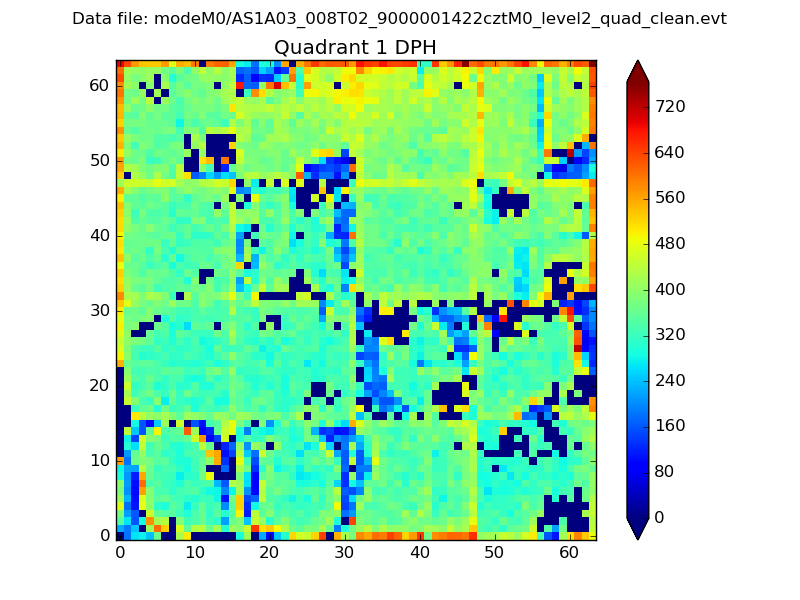
Histogram calculated using DETX and DETY for each event in the final _common_clean file
| Quadrant A |  |
 |
Quadrant B |
|---|---|---|---|
| Quadrant D |  |
 |
Quadrant C |
| Plot type | Count rate plots | Images |
|---|---|---|
| Comparison with Poisson distribution Blue bars denote a histogram of data divided into 1 sec bins. Red curve is a Poisson curve with rate = median count rate of data. |
 |
 |
| Quadrant-wise count rates Data is divided into 100 sec bins |
 |
|
| Module-wise count rates for Quadrant A Data is divided into 100 sec bins |
 |
 |
| Module-wise count rates for Quadrant B Data is divided into 100 sec bins |
 |
 |
| Module-wise count rates for Quadrant C Data is divided into 100 sec bins |
 |
 |
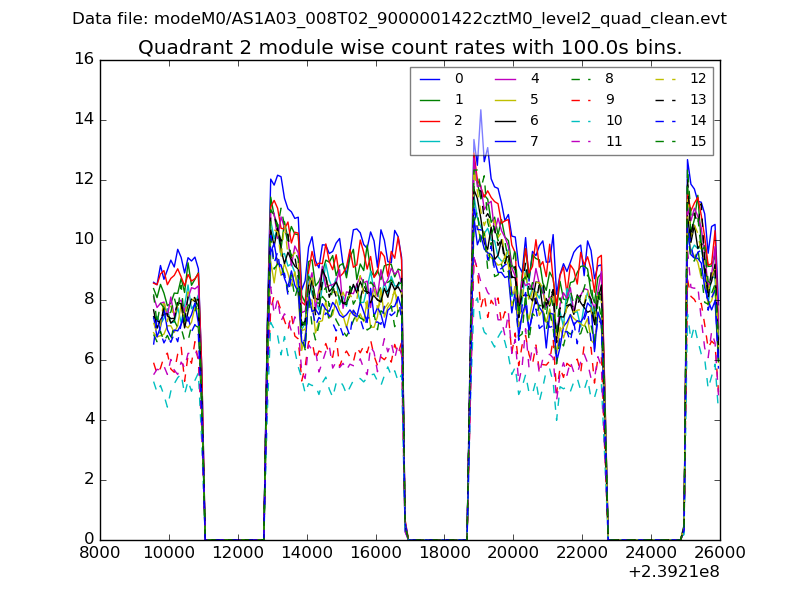
| Module-wise count rates for Quadrant D Data is divided into 100 sec bins |
 |
 |
| Parameter | Plot |
|---|---|
| CZT HV Monitor |  |
| D_VDD | 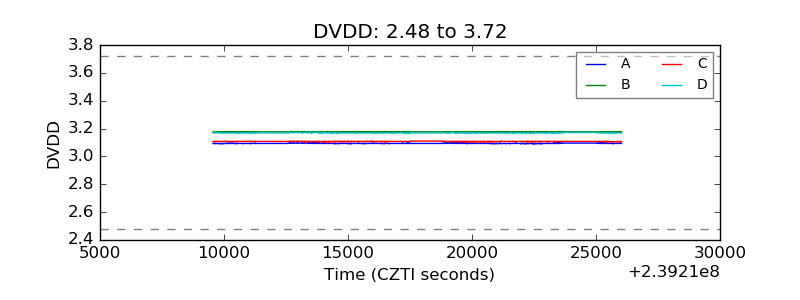 |
| Temperature 1 |  |
| Veto HV Monitor |  |
| Veto LLD |  |
| Alpha Counter |  |
| _CPM_Rate |  |
| CZT Counter |  |
| +2.5 Volts monitor |  |
| +5 Volts monitor |  |
| _ROLL_ROT | 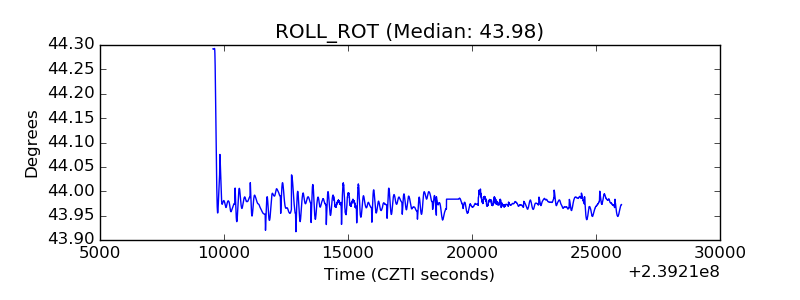 |
| _Roll_DEC |  |
| _Roll_RA |  |
| Veto Counter |  |