| Param | Original file | Final file |
|---|---|---|
| Filename | modeM0/AS1G07_016T01_9000001420cztM0_level2.evt | modeM0/AS1G07_016T01_9000001420cztM0_level2_quad_clean.evt |
| Size (bytes) | 5,679,288,000 | 953,383,680 |
| Size | 5.3 GB | 909.2 MB |
| Events in quadrant A | 37,124,299 | 5,987,201 |
| Events in quadrant B | 39,819,250 | 6,033,624 |
| Events in quadrant C | 34,574,341 | 6,031,271 |
| Events in quadrant D | 55,294,679 | 5,552,689 |
| Mode M0 | |||
|---|---|---|---|
| Quadrant | BADHDUFLAG | Total packets | Discarded packets |
| A | 0 | 162842 | 0 |
| B | 0 | 169514 | 0 |
| C | 0 | 157692 | 0 |
| D | 0 | 215401 | 0 |
| Mode M9 | |||
|---|---|---|---|
| Quadrant | BADHDUFLAG | Total packets | Discarded packets |
| A | 0 | 133 | 0 |
| B | 0 | 131 | 0 |
| C | 0 | 132 | 0 |
| D | 0 | 131 | 0 |
| Mode SS | |||
|---|---|---|---|
| Quadrant | BADHDUFLAG | Total packets | Discarded packets |
| A | 0 | 1578 | 0 |
| B | 0 | 1592 | 0 |
| C | 0 | 1562 | 0 |
| D | 0 | 1574 | 0 |
| Quadrant | Total seconds | Saturated seconds | Saturation percentage |
|---|---|---|---|
| A | 76906 | 1104 | 1.435519% |
| B | 76841 | 1452 | 1.889616% |
| C | 76985 | 686 | 0.891083% |
| D | 76566 | 3621 | 4.729253% |
Noise dominated data is calculated using 1-second bins in cleaned event files. If a bin has >2000 counts, and if more than 50% of those come from <1% of pixels, then it is considered to be noise-dominated and hence unusable.
| Quadrant | # 1 sec bins | Bins with >0 counts | Bins with >2000 counts | High rate bins dominated by noise | Noise dominated (total time) | Noise dominated (detector-on time) | Marked lightcurve |
|---|---|---|---|---|---|---|---|
| A | 92449 | 78432 | 50 | 50 | 0.05% | 0.06% |  |
| B | 92449 | 78352 | 379 | 379 | 0.41% | 0.48% |  |
| C | 92449 | 78452 | 3 | 3 | 0.00% | 0.00% |  |
| D | 92449 | 78220 | 2933 | 2933 | 3.17% | 3.75% | 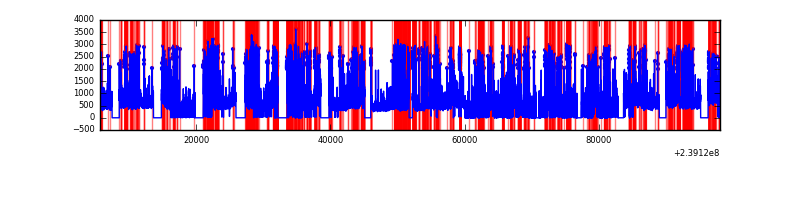 |
Top three noisy pixels from each quadrant. If the there are fewer than three noisy pixels in the level2.evt file, extra rows are filled as -1
| Pixel properties | Quadrant properties | ||||||
|---|---|---|---|---|---|---|---|
| Quadrant | DetID | PixID | Counts | Sigma | Mean | Median | Sigma |
| A | 15 | 239 | 740330 | 399.98 | 9044 | 8860 | 1828.8 |
| A | 8 | 15 | 571978 | 307.92 | 9044 | 8860 | 1828.8 |
| A | 15 | 174 | 370053 | 197.51 | 9044 | 8860 | 1828.8 |
| B | 4 | 81 | 1405193 | 817.94 | 9078 | 8870 | 1707.1 |
| B | 4 | 239 | 1328991 | 773.3 | 9078 | 8870 | 1707.1 |
| B | 0 | 214 | 630720 | 364.27 | 9078 | 8870 | 1707.1 |
| C | 8 | 208 | 110394 | 50.25 | 8797 | 8830 | 2021.1 |
| C | 13 | 61 | 66750 | 28.66 | 8797 | 8830 | 2021.1 |
| C | 7 | 247 | 56984 | 23.83 | 8797 | 8830 | 2021.1 |
| D | 2 | 16 | 5525627 | 2473.45 | 8535 | 8307 | 2230.6 |
| D | 8 | 195 | 4143893 | 1854.01 | 8535 | 8307 | 2230.6 |
| D | 10 | 253 | 3407034 | 1523.67 | 8535 | 8307 | 2230.6 |
Histogram calculated using DETX and DETY for each event in the final _common_clean file
| Quadrant A |  |
 |
Quadrant B |
|---|---|---|---|
| Quadrant D | 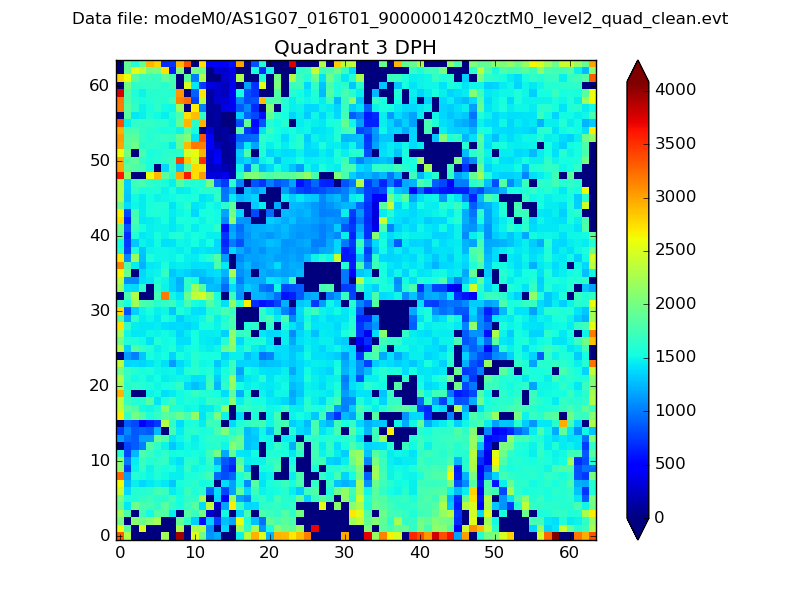 |
 |
Quadrant C |
| Plot type | Count rate plots | Images |
|---|---|---|
| Comparison with Poisson distribution Blue bars denote a histogram of data divided into 1 sec bins. Red curve is a Poisson curve with rate = median count rate of data. |
 |
 |
| Quadrant-wise count rates Data is divided into 100 sec bins |
 |
|
| Module-wise count rates for Quadrant A Data is divided into 100 sec bins |
 |
 |
| Module-wise count rates for Quadrant B Data is divided into 100 sec bins |
 |
 |
| Module-wise count rates for Quadrant C Data is divided into 100 sec bins |
 |
 |
| Module-wise count rates for Quadrant D Data is divided into 100 sec bins |
 |
 |
| Parameter | Plot |
|---|---|
| CZT HV Monitor |  |
| D_VDD |  |
| Temperature 1 |  |
| Veto HV Monitor |  |
| Veto LLD |  |
| Alpha Counter |  |
| _CPM_Rate | 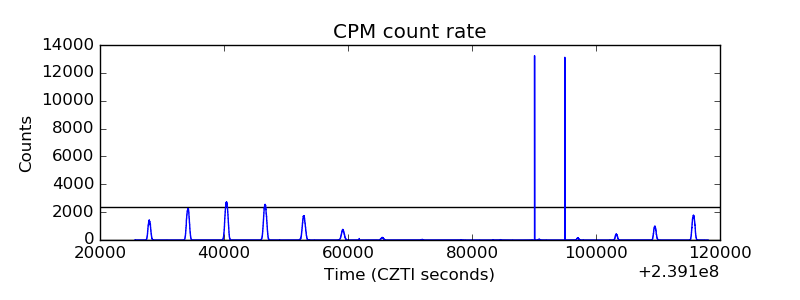 |
| CZT Counter |  |
| +2.5 Volts monitor |  |
| +5 Volts monitor |  |
| _ROLL_ROT |  |
| _Roll_DEC |  |
| _Roll_RA | 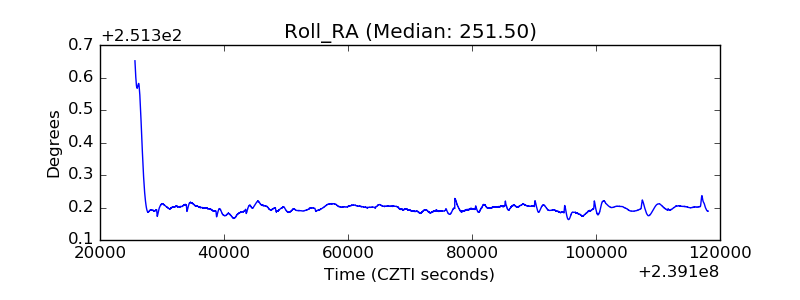 |
| Veto Counter |  |