| Param | Original file | Final file |
|---|---|---|
| Filename | modeM0/AS1G07_027T01_9000001414cztM0_level2.evt | modeM0/AS1G07_027T01_9000001414cztM0_level2_quad_clean.evt |
| Size (bytes) | 1,310,420,160 | 216,112,320 |
| Size | 1.2 GB | 206.1 MB |
| Events in quadrant A | 8,443,656 | 1,397,760 |
| Events in quadrant B | 7,485,101 | 1,420,253 |
| Events in quadrant C | 7,005,511 | 1,389,787 |
| Events in quadrant D | 15,707,198 | 1,269,167 |
| Mode SS | |||
|---|---|---|---|
| Quadrant | BADHDUFLAG | Total packets | Discarded packets |
| A | 0 | 318 | 0 |
| B | 0 | 318 | 0 |
| C | 0 | 318 | 0 |
| D | 0 | 318 | 0 |
| Mode M9 | |||
|---|---|---|---|
| Quadrant | BADHDUFLAG | Total packets | Discarded packets |
| A | 0 | 18 | 0 |
| B | 0 | 18 | 0 |
| C | 0 | 18 | 0 |
| D | 0 | 18 | 0 |
| Mode M0 | |||
|---|---|---|---|
| Quadrant | BADHDUFLAG | Total packets | Discarded packets |
| A | 0 | 35361 | 0 |
| B | 0 | 32319 | 0 |
| C | 0 | 31446 | 0 |
| D | 0 | 56785 | 0 |
| Quadrant | Total seconds | Saturated seconds | Saturation percentage |
|---|---|---|---|
| A | 15479 | 353 | 2.280509% |
| B | 15476 | 263 | 1.699406% |
| C | 15479 | 187 | 1.208088% |
| D | 15476 | 1757 | 11.353063% |
Noise dominated data is calculated using 1-second bins in cleaned event files. If a bin has >2000 counts, and if more than 50% of those come from <1% of pixels, then it is considered to be noise-dominated and hence unusable.
| Quadrant | # 1 sec bins | Bins with >0 counts | Bins with >2000 counts | High rate bins dominated by noise | Noise dominated (total time) | Noise dominated (detector-on time) | Marked lightcurve |
|---|---|---|---|---|---|---|---|
| A | 17336 | 15481 | 102 | 102 | 0.59% | 0.66% |  |
| B | 17336 | 15481 | 28 | 28 | 0.16% | 0.18% |  |
| C | 17336 | 15481 | 0 | 0 | 0.00% | 0.00% |  |
| D | 17336 | 15481 | 1937 | 1937 | 11.17% | 12.51% | 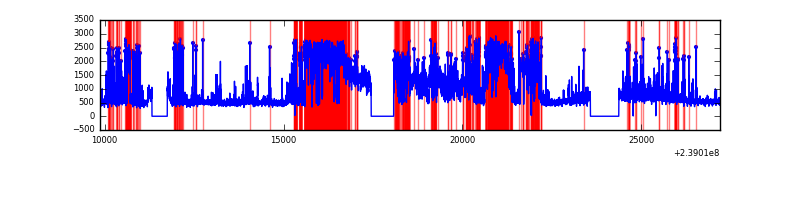 |
Top three noisy pixels from each quadrant. If the there are fewer than three noisy pixels in the level2.evt file, extra rows are filled as -1
| Pixel properties | Quadrant properties | ||||||
|---|---|---|---|---|---|---|---|
| Quadrant | DetID | PixID | Counts | Sigma | Mean | Median | Sigma |
| A | 15 | 239 | 1367354 | 3691.18 | 1826 | 1783 | 370.0 |
| A | 15 | 174 | 32318 | 82.54 | 1826 | 1783 | 370.0 |
| A | 0 | 226 | 16596 | 40.04 | 1826 | 1783 | 370.0 |
| B | 0 | 214 | 69838 | 193.23 | 1839 | 1799 | 352.1 |
| B | 0 | 197 | 58151 | 160.04 | 1839 | 1799 | 352.1 |
| B | 0 | 85 | 54203 | 148.82 | 1839 | 1799 | 352.1 |
| C | 14 | 67 | 20915 | 46.22 | 1788 | 1799 | 413.6 |
| C | 13 | 61 | 13458 | 28.19 | 1788 | 1799 | 413.6 |
| C | 14 | 234 | 7716 | 14.31 | 1788 | 1799 | 413.6 |
| D | 1 | 52 | 6714477 | 15897.26 | 1727 | 1684 | 422.3 |
| D | 8 | 195 | 1186583 | 2806.08 | 1727 | 1684 | 422.3 |
| D | 2 | 16 | 794055 | 1876.5 | 1727 | 1684 | 422.3 |
Histogram calculated using DETX and DETY for each event in the final _common_clean file
| Quadrant A |  |
 |
Quadrant B |
|---|---|---|---|
| Quadrant D | 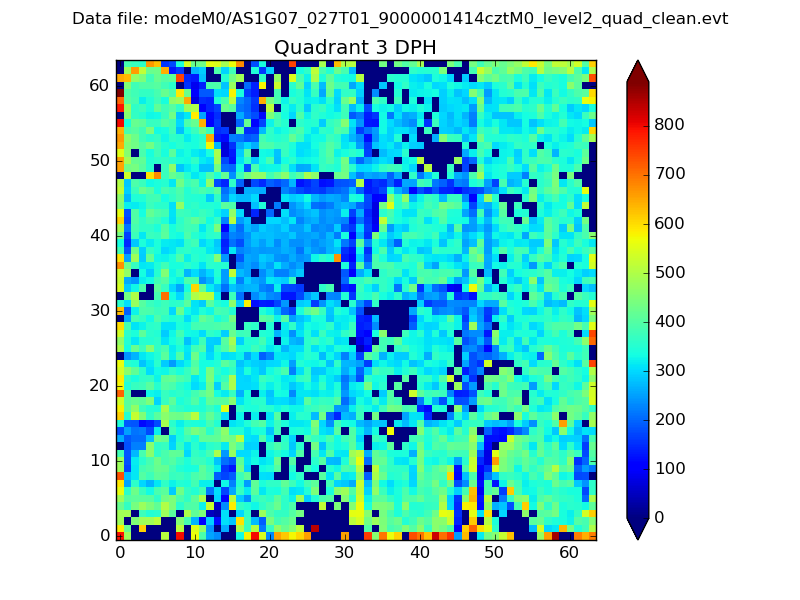 |
 |
Quadrant C |
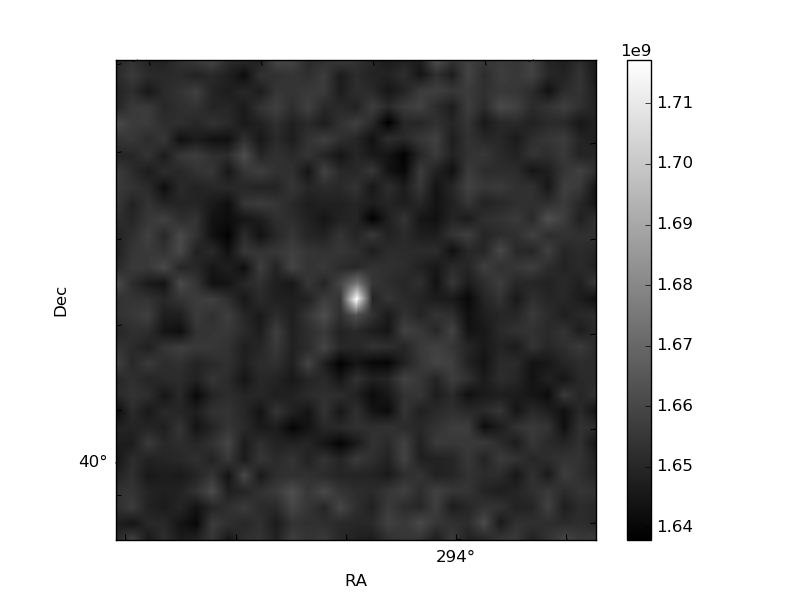
| Plot type | Count rate plots | Images |
|---|---|---|
| Comparison with Poisson distribution Blue bars denote a histogram of data divided into 1 sec bins. Red curve is a Poisson curve with rate = median count rate of data. |
 |
 |
| Quadrant-wise count rates Data is divided into 100 sec bins |
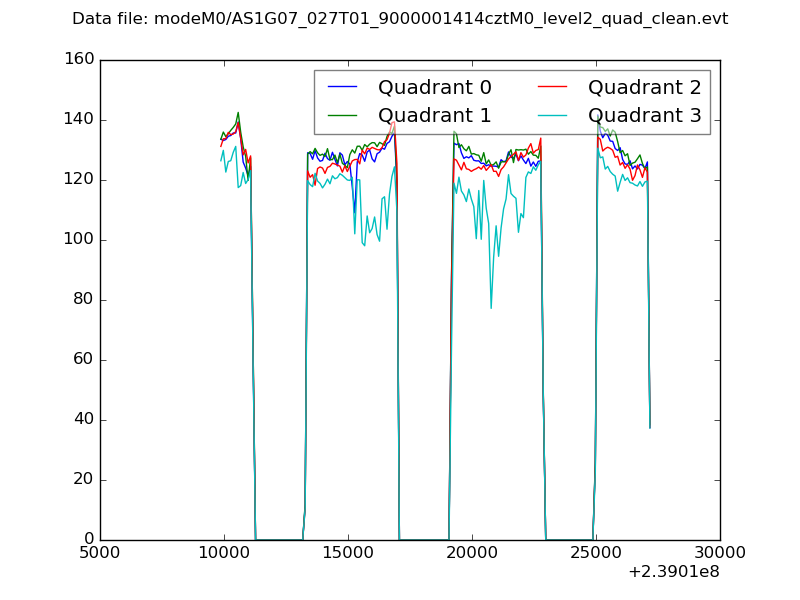 |
|
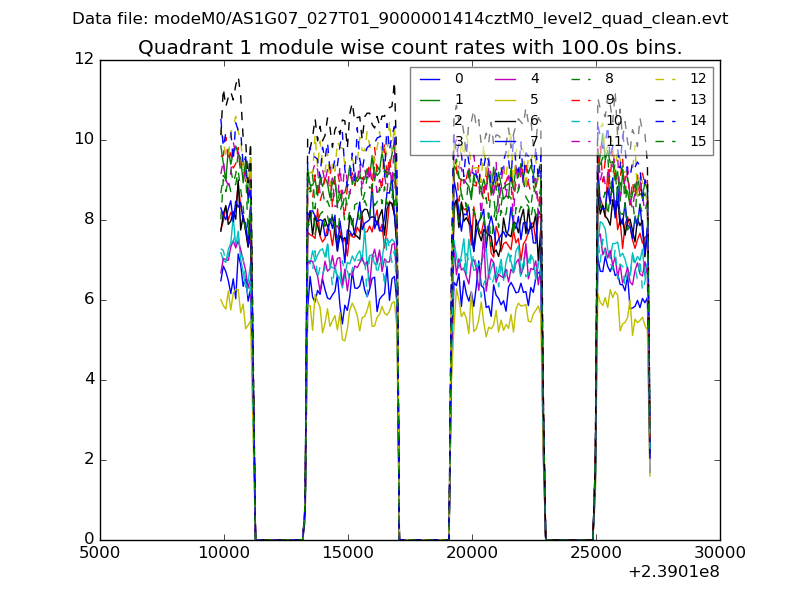
| Module-wise count rates for Quadrant A Data is divided into 100 sec bins |
 |
 |
| Module-wise count rates for Quadrant B Data is divided into 100 sec bins |
 |
 |
| Module-wise count rates for Quadrant C Data is divided into 100 sec bins |
 |
 |
| Module-wise count rates for Quadrant D Data is divided into 100 sec bins |
 |
 |
| Parameter | Plot |
|---|---|
| CZT HV Monitor |  |
| D_VDD |  |
| Temperature 1 |  |
| Veto HV Monitor |  |
| Veto LLD |  |
| Alpha Counter |  |
| _CPM_Rate |  |
| CZT Counter |  |
| +2.5 Volts monitor |  |
| +5 Volts monitor |  |
| _ROLL_ROT |  |
| _Roll_DEC | 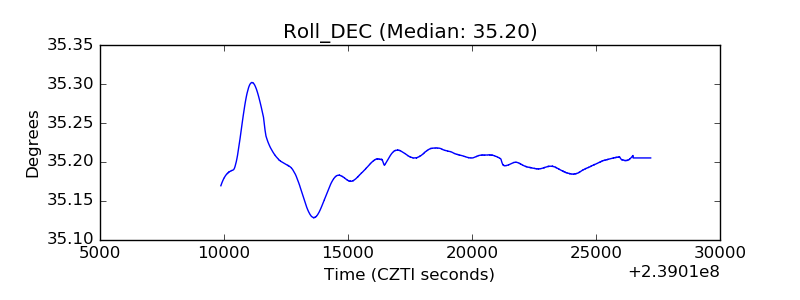 |
| _Roll_RA |  |
| Veto Counter |  |