| Param | Original file | Final file |
|---|---|---|
| Filename | modeM0/AS1A02_029T01_9000001416cztM0_level2.evt | modeM0/AS1A02_029T01_9000001416cztM0_level2_quad_clean.evt |
| Size (bytes) | 2,944,491,840 | 440,608,320 |
| Size | 2.7 GB | 420.2 MB |
| Events in quadrant A | 20,924,653 | 2,750,330 |
| Events in quadrant B | 19,316,702 | 2,809,061 |
| Events in quadrant C | 17,454,547 | 2,756,073 |
| Events in quadrant D | 28,924,390 | 2,427,950 |
| Mode M0 | |||
|---|---|---|---|
| Quadrant | BADHDUFLAG | Total packets | Discarded packets |
| A | 0 | 87636 | 0 |
| B | 0 | 82387 | 0 |
| C | 0 | 77999 | 0 |
| D | 0 | 111287 | 0 |
| Mode SS | |||
|---|---|---|---|
| Quadrant | BADHDUFLAG | Total packets | Discarded packets |
| A | 0 | 772 | 0 |
| B | 0 | 776 | 0 |
| C | 0 | 772 | 0 |
| D | 0 | 770 | 0 |
| Mode M9 | |||
|---|---|---|---|
| Quadrant | BADHDUFLAG | Total packets | Discarded packets |
| A | 0 | 91 | 0 |
| B | 0 | 91 | 0 |
| C | 0 | 89 | 0 |
| D | 0 | 91 | 0 |
| Quadrant | Total seconds | Saturated seconds | Saturation percentage |
|---|---|---|---|
| A | 37881 | 600 | 1.583907% |
| B | 37918 | 466 | 1.228968% |
| C | 37902 | 221 | 0.583083% |
| D | 37763 | 2527 | 6.691735% |
Noise dominated data is calculated using 1-second bins in cleaned event files. If a bin has >2000 counts, and if more than 50% of those come from <1% of pixels, then it is considered to be noise-dominated and hence unusable.
| Quadrant | # 1 sec bins | Bins with >0 counts | Bins with >2000 counts | High rate bins dominated by noise | Noise dominated (total time) | Noise dominated (detector-on time) | Marked lightcurve |
|---|---|---|---|---|---|---|---|
| A | 47769 | 38539 | 117 | 117 | 0.24% | 0.30% |  |
| B | 47769 | 38542 | 29 | 29 | 0.06% | 0.08% |  |
| C | 47769 | 38541 | 4 | 4 | 0.01% | 0.01% |  |
| D | 47769 | 38461 | 2321 | 2321 | 4.86% | 6.03% |  |
Top three noisy pixels from each quadrant. If the there are fewer than three noisy pixels in the level2.evt file, extra rows are filled as -1
| Pixel properties | Quadrant properties | ||||||
|---|---|---|---|---|---|---|---|
| Quadrant | DetID | PixID | Counts | Sigma | Mean | Median | Sigma |
| A | 15 | 239 | 3068161 | 3349.67 | 4565 | 4475 | 914.6 |
| A | 14 | 111 | 153841 | 163.31 | 4565 | 4475 | 914.6 |
| A | 8 | 15 | 99733 | 104.15 | 4565 | 4475 | 914.6 |
| B | 4 | 81 | 275130 | 308.37 | 4634 | 4526 | 877.5 |
| B | 0 | 214 | 219327 | 244.78 | 4634 | 4526 | 877.5 |
| B | 4 | 239 | 211874 | 236.29 | 4634 | 4526 | 877.5 |
| C | 12 | 4 | 43015 | 37.4 | 4455 | 4476 | 1030.6 |
| C | 13 | 61 | 34030 | 28.68 | 4455 | 4476 | 1030.6 |
| C | 14 | 67 | 20376 | 15.43 | 4455 | 4476 | 1030.6 |
| D | 2 | 16 | 3954362 | 3706.04 | 4239 | 4138 | 1065.9 |
| D | 8 | 195 | 2636124 | 2469.29 | 4239 | 4138 | 1065.9 |
| D | 1 | 52 | 2169593 | 2031.6 | 4239 | 4138 | 1065.9 |
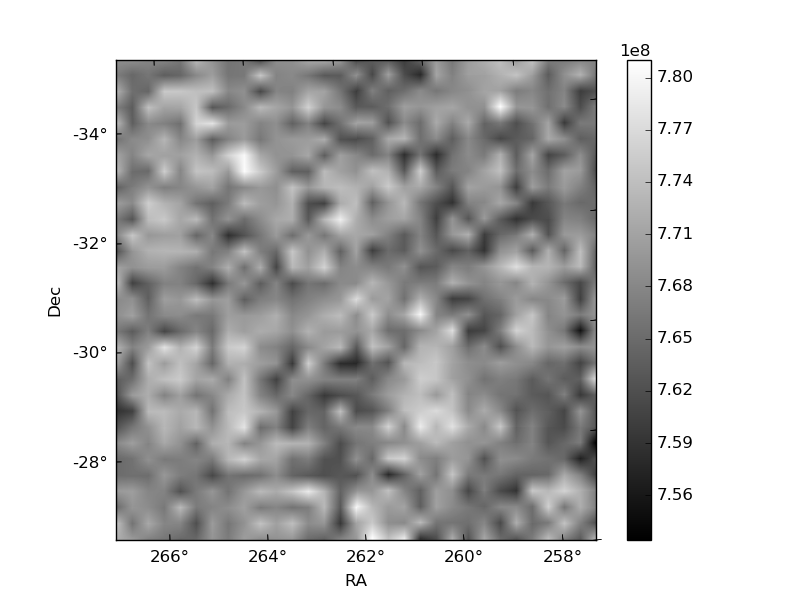
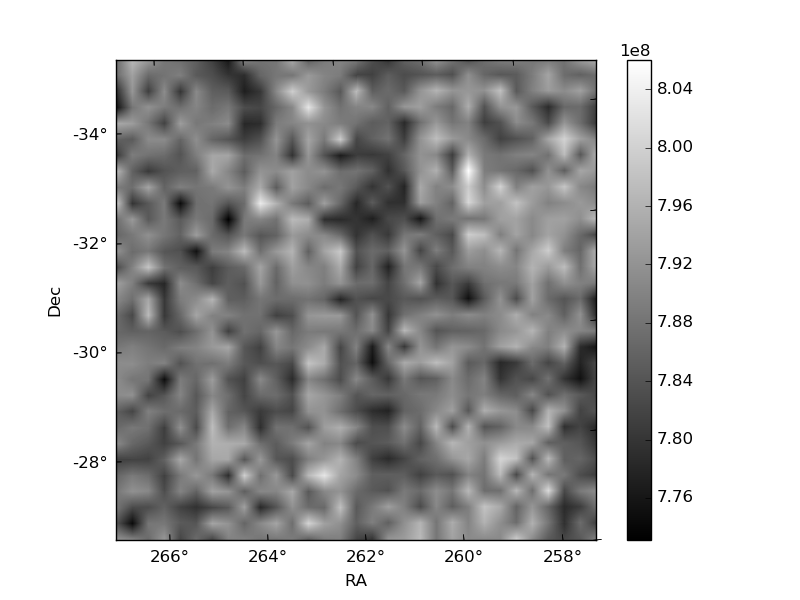
Histogram calculated using DETX and DETY for each event in the final _common_clean file
| Quadrant A |  |
 |
Quadrant B |
|---|---|---|---|
| Quadrant D |  |
 |
Quadrant C |
| Plot type | Count rate plots | Images |
|---|---|---|
| Comparison with Poisson distribution Blue bars denote a histogram of data divided into 1 sec bins. Red curve is a Poisson curve with rate = median count rate of data. |
 |
 |
| Quadrant-wise count rates Data is divided into 100 sec bins |
 |
|
| Module-wise count rates for Quadrant A Data is divided into 100 sec bins |
 |
 |
| Module-wise count rates for Quadrant B Data is divided into 100 sec bins |
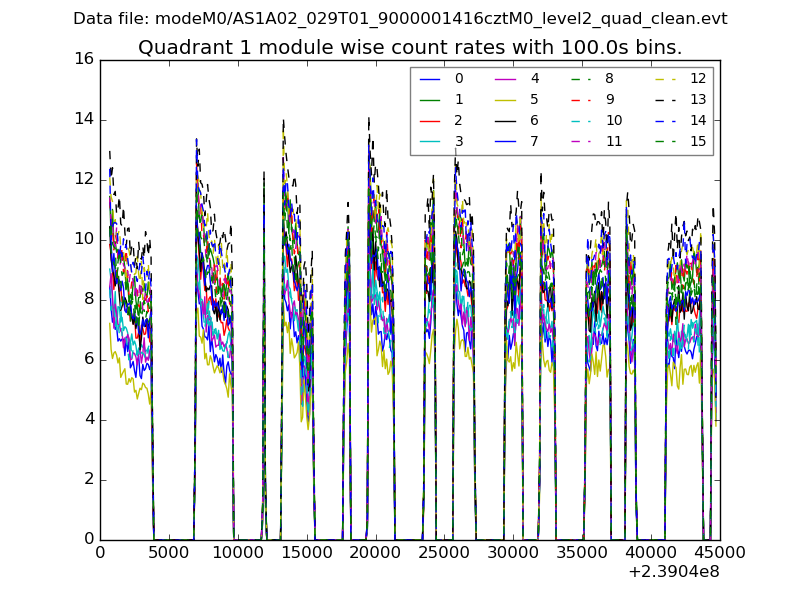 |
 |
| Module-wise count rates for Quadrant C Data is divided into 100 sec bins |
 |
 |
| Module-wise count rates for Quadrant D Data is divided into 100 sec bins |
 |
 |
| Parameter | Plot |
|---|---|
| CZT HV Monitor | 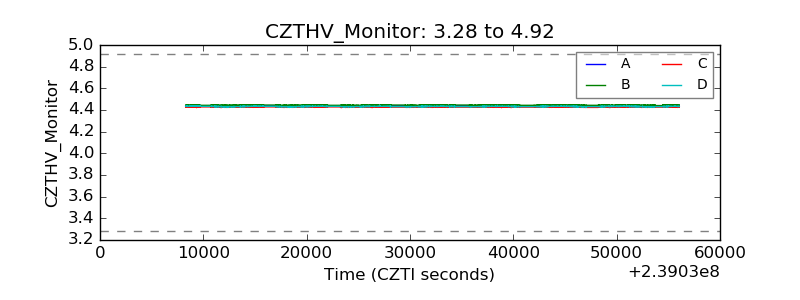 |
| D_VDD |  |
| Temperature 1 |  |
| Veto HV Monitor |  |
| Veto LLD |  |
| Alpha Counter |  |
| _CPM_Rate |  |
| CZT Counter |  |
| +2.5 Volts monitor |  |
| +5 Volts monitor |  |
| _ROLL_ROT |  |
| _Roll_DEC |  |
| _Roll_RA |  |
| Veto Counter |  |