| Param | Original file | Final file |
|---|---|---|
| Filename | modeM0/AS1A03_009T01_9000001412cztM0_level2.evt | modeM0/AS1A03_009T01_9000001412cztM0_level2_quad_clean.evt |
| Size (bytes) | 2,498,549,760 | 404,055,360 |
| Size | 2.3 GB | 385.3 MB |
| Events in quadrant A | 16,427,096 | 2,507,388 |
| Events in quadrant B | 16,454,463 | 2,552,824 |
| Events in quadrant C | 15,249,825 | 2,562,910 |
| Events in quadrant D | 25,281,743 | 2,319,053 |
| Mode M0 | |||
|---|---|---|---|
| Quadrant | BADHDUFLAG | Total packets | Discarded packets |
| A | 0 | 72002 | 0 |
| B | 0 | 71231 | 0 |
| C | 0 | 69208 | 0 |
| D | 0 | 97475 | 0 |
| Mode SS | |||
|---|---|---|---|
| Quadrant | BADHDUFLAG | Total packets | Discarded packets |
| A | 0 | 692 | 0 |
| B | 0 | 680 | 0 |
| C | 0 | 692 | 0 |
| D | 0 | 688 | 0 |
| Mode M9 | |||
|---|---|---|---|
| Quadrant | BADHDUFLAG | Total packets | Discarded packets |
| A | 0 | 40 | 0 |
| B | 0 | 40 | 0 |
| C | 0 | 40 | 0 |
| D | 0 | 40 | 0 |
| Quadrant | Total seconds | Saturated seconds | Saturation percentage |
|---|---|---|---|
| A | 33530 | 748 | 2.230838% |
| B | 33541 | 766 | 2.283772% |
| C | 33613 | 561 | 1.668997% |
| D | 32747 | 1763 | 5.383699% |
Noise dominated data is calculated using 1-second bins in cleaned event files. If a bin has >2000 counts, and if more than 50% of those come from <1% of pixels, then it is considered to be noise-dominated and hence unusable.
| Quadrant | # 1 sec bins | Bins with >0 counts | Bins with >2000 counts | High rate bins dominated by noise | Noise dominated (total time) | Noise dominated (detector-on time) | Marked lightcurve |
|---|---|---|---|---|---|---|---|
| A | 39646 | 34583 | 107 | 107 | 0.27% | 0.31% |  |
| B | 39647 | 34647 | 27 | 27 | 0.07% | 0.08% |  |
| C | 39647 | 34691 | 3 | 3 | 0.01% | 0.01% |  |
| D | 39647 | 34031 | 1104 | 1104 | 2.78% | 3.24% |  |
Top three noisy pixels from each quadrant. If the there are fewer than three noisy pixels in the level2.evt file, extra rows are filled as -1
| Pixel properties | Quadrant properties | ||||||
|---|---|---|---|---|---|---|---|
| Quadrant | DetID | PixID | Counts | Sigma | Mean | Median | Sigma |
| A | 15 | 239 | 909409 | 1138.11 | 3955 | 3867 | 795.7 |
| A | 14 | 254 | 206249 | 254.36 | 3955 | 3867 | 795.7 |
| A | 14 | 111 | 47678 | 55.06 | 3955 | 3867 | 795.7 |
| B | 0 | 214 | 303812 | 398.1 | 3991 | 3896 | 753.4 |
| B | 4 | 81 | 146620 | 189.45 | 3991 | 3896 | 753.4 |
| B | 4 | 239 | 135836 | 175.14 | 3991 | 3896 | 753.4 |
| C | 13 | 61 | 29289 | 28.46 | 3889 | 3901 | 892.1 |
| C | 9 | 221 | 28388 | 27.45 | 3889 | 3901 | 892.1 |
| C | 12 | 4 | 20320 | 18.4 | 3889 | 3901 | 892.1 |
| D | 2 | 16 | 2951301 | 3210.68 | 3686 | 3594 | 918.1 |
| D | 8 | 195 | 2885642 | 3139.16 | 3686 | 3594 | 918.1 |
| D | 1 | 52 | 1985429 | 2158.64 | 3686 | 3594 | 918.1 |
Histogram calculated using DETX and DETY for each event in the final _common_clean file
| Quadrant A | 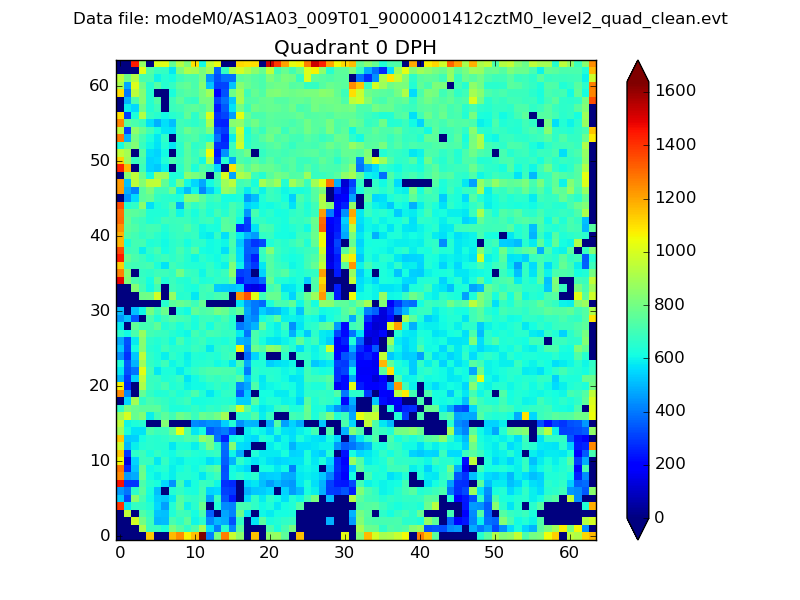 |
 |
Quadrant B |
|---|---|---|---|
| Quadrant D |  |
 |
Quadrant C |
| Plot type | Count rate plots | Images |
|---|---|---|
| Comparison with Poisson distribution Blue bars denote a histogram of data divided into 1 sec bins. Red curve is a Poisson curve with rate = median count rate of data. |
 |
 |
| Quadrant-wise count rates Data is divided into 100 sec bins |
 |
|
| Module-wise count rates for Quadrant A Data is divided into 100 sec bins |
 |
 |
| Module-wise count rates for Quadrant B Data is divided into 100 sec bins |
 |
 |
| Module-wise count rates for Quadrant C Data is divided into 100 sec bins |
 |
 |
| Module-wise count rates for Quadrant D Data is divided into 100 sec bins |
 |
 |
| Parameter | Plot |
|---|---|
| CZT HV Monitor |  |
| D_VDD |  |
| Temperature 1 |  |
| Veto HV Monitor |  |
| Veto LLD |  |
| Alpha Counter |  |
| _CPM_Rate |  |
| CZT Counter |  |
| +2.5 Volts monitor |  |
| +5 Volts monitor |  |
| _ROLL_ROT |  |
| _Roll_DEC |  |
| _Roll_RA |  |
| Veto Counter |  |