| Param | Original file | Final file |
|---|---|---|
| Filename | modeM0/AS1G07_028T01_9000001406cztM0_level2.evt | modeM0/AS1G07_028T01_9000001406cztM0_level2_quad_clean.evt |
| Size (bytes) | 866,787,840 | 163,782,720 |
| Size | 826.6 MB | 156.2 MB |
| Events in quadrant A | 6,306,078 | 1,015,936 |
| Events in quadrant B | 6,407,721 | 1,035,945 |
| Events in quadrant C | 6,126,653 | 1,007,485 |
| Events in quadrant D | 6,490,791 | 963,894 |
| Mode M0 | |||
|---|---|---|---|
| Quadrant | BADHDUFLAG | Total packets | Discarded packets |
| A | 0 | 27819 | 0 |
| B | 0 | 27993 | 0 |
| C | 0 | 27686 | 0 |
| D | 0 | 28730 | 0 |
| Mode SS | |||
|---|---|---|---|
| Quadrant | BADHDUFLAG | Total packets | Discarded packets |
| A | 0 | 276 | 0 |
| B | 0 | 276 | 0 |
| C | 0 | 276 | 0 |
| D | 0 | 276 | 0 |
| Mode M9 | |||
|---|---|---|---|
| Quadrant | BADHDUFLAG | Total packets | Discarded packets |
| A | 0 | 10 | 0 |
| B | 0 | 10 | 0 |
| C | 0 | 10 | 0 |
| D | 0 | 10 | 0 |
| Quadrant | Total seconds | Saturated seconds | Saturation percentage |
|---|---|---|---|
| A | 13566 | 180 | 1.326847% |
| B | 13566 | 180 | 1.326847% |
| C | 13566 | 125 | 0.921421% |
| D | 13566 | 136 | 1.002506% |
Noise dominated data is calculated using 1-second bins in cleaned event files. If a bin has >2000 counts, and if more than 50% of those come from <1% of pixels, then it is considered to be noise-dominated and hence unusable.
| Quadrant | # 1 sec bins | Bins with >0 counts | Bins with >2000 counts | High rate bins dominated by noise | Noise dominated (total time) | Noise dominated (detector-on time) | Marked lightcurve |
|---|---|---|---|---|---|---|---|
| A | 14626 | 13568 | 4 | 4 | 0.03% | 0.03% |  |
| B | 14626 | 13568 | 10 | 10 | 0.07% | 0.07% |  |
| C | 14626 | 13568 | 21 | 21 | 0.14% | 0.15% |  |
| D | 14626 | 13568 | 19 | 19 | 0.13% | 0.14% | 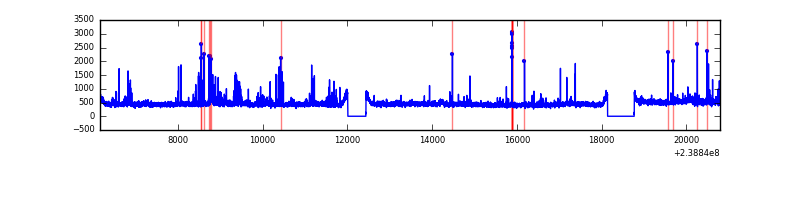 |
Top three noisy pixels from each quadrant. If the there are fewer than three noisy pixels in the level2.evt file, extra rows are filled as -1
| Pixel properties | Quadrant properties | ||||||
|---|---|---|---|---|---|---|---|
| Quadrant | DetID | PixID | Counts | Sigma | Mean | Median | Sigma |
| A | 13 | 251 | 77977 | 234.13 | 1595 | 1557 | 326.4 |
| A | 15 | 239 | 53966 | 160.57 | 1595 | 1557 | 326.4 |
| A | 14 | 111 | 40617 | 119.67 | 1595 | 1557 | 326.4 |
| B | 4 | 81 | 132569 | 424.14 | 1596 | 1553 | 308.9 |
| B | 0 | 229 | 48324 | 151.41 | 1596 | 1553 | 308.9 |
| B | 12 | 111 | 37130 | 115.18 | 1596 | 1553 | 308.9 |
| C | 10 | 22 | 54993 | 148.03 | 1553 | 1561 | 360.9 |
| C | 9 | 221 | 13047 | 31.82 | 1553 | 1561 | 360.9 |
| C | 13 | 61 | 11538 | 27.64 | 1553 | 1561 | 360.9 |
| D | 1 | 52 | 226006 | 565.09 | 1530 | 1498 | 397.3 |
| D | 10 | 253 | 151583 | 377.77 | 1530 | 1498 | 397.3 |
| D | 8 | 195 | 100183 | 248.39 | 1530 | 1498 | 397.3 |
Histogram calculated using DETX and DETY for each event in the final _common_clean file
| Quadrant A |  |
 |
Quadrant B |
|---|---|---|---|
| Quadrant D | 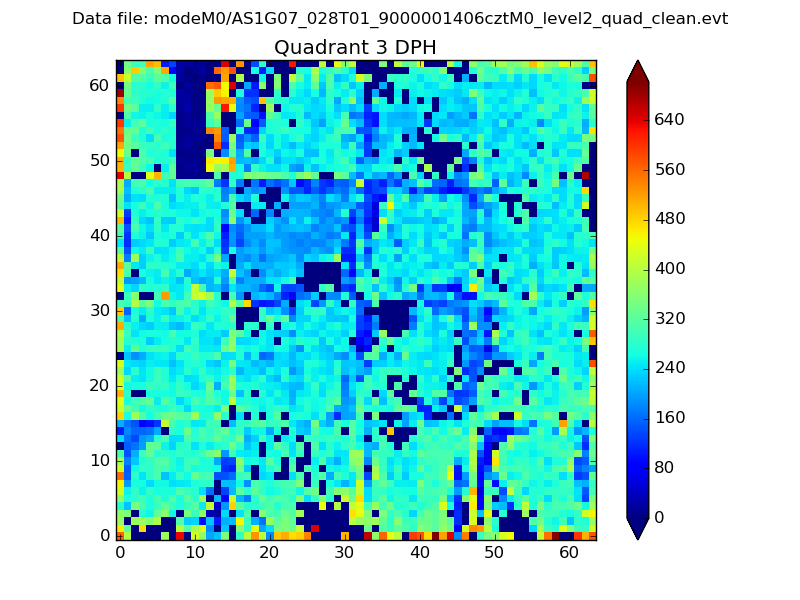 |
 |
Quadrant C |
| Plot type | Count rate plots | Images |
|---|---|---|
| Comparison with Poisson distribution Blue bars denote a histogram of data divided into 1 sec bins. Red curve is a Poisson curve with rate = median count rate of data. |
 |
 |
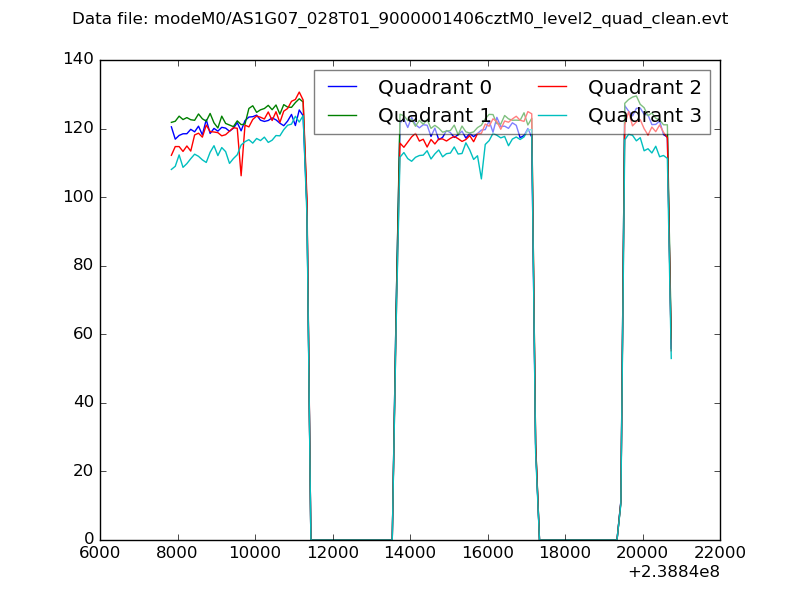
| Quadrant-wise count rates Data is divided into 100 sec bins |
 |
|
| Module-wise count rates for Quadrant A Data is divided into 100 sec bins |
 |
 |
| Module-wise count rates for Quadrant B Data is divided into 100 sec bins |
 |
 |
| Module-wise count rates for Quadrant C Data is divided into 100 sec bins |
 |
 |
| Module-wise count rates for Quadrant D Data is divided into 100 sec bins |
 |
 |
| Parameter | Plot |
|---|---|
| CZT HV Monitor |  |
| D_VDD |  |
| Temperature 1 |  |
| Veto HV Monitor |  |
| Veto LLD | 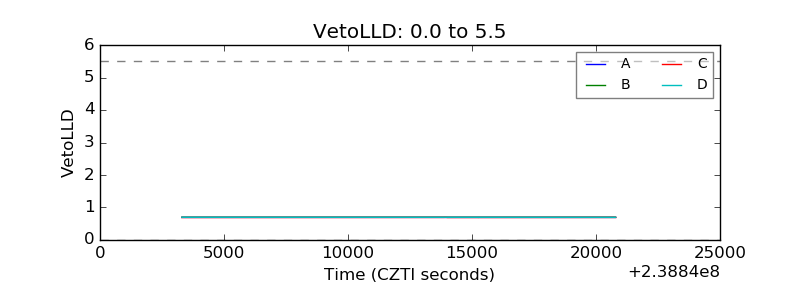 |
| Alpha Counter |  |
| _CPM_Rate | 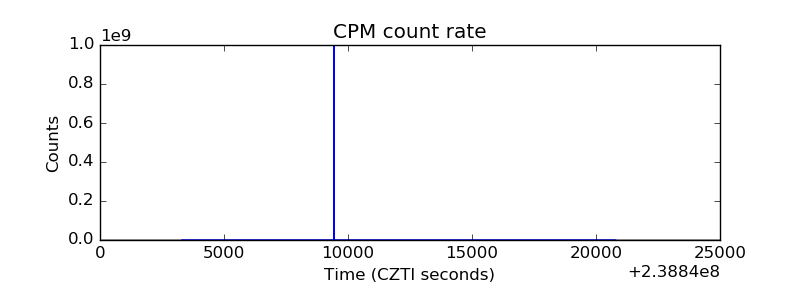 |
| CZT Counter |  |
| +2.5 Volts monitor |  |
| +5 Volts monitor | 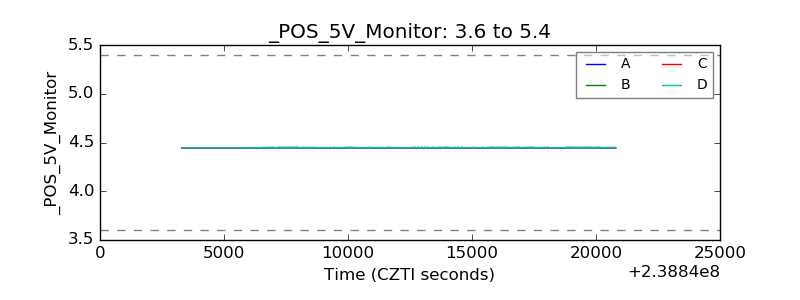 |
| _ROLL_ROT | 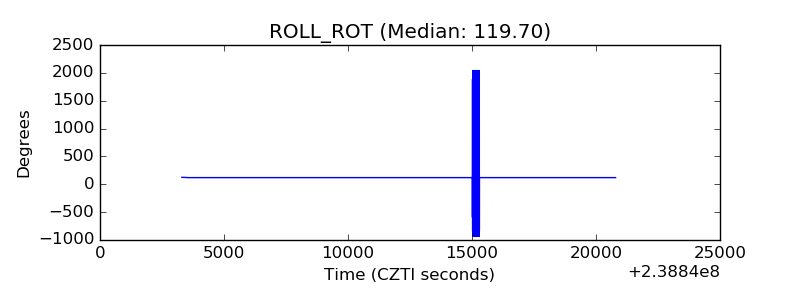 |
| _Roll_DEC |  |
| _Roll_RA | 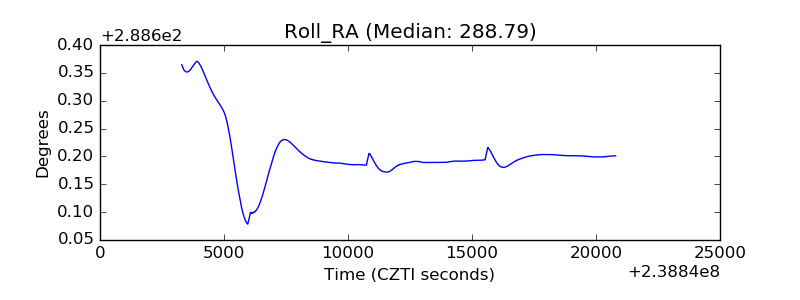 |
| Veto Counter |  |