| Param | Original file | Final file |
|---|---|---|
| Filename | modeM0/AS1A03_117T06_9000001404cztM0_level2_bc.evt | modeM0/AS1A03_117T06_9000001404cztM0_level2_quad_clean.evt |
| Size (bytes) | 105,808,320 | 36,023,040 |
| Size | 100.9 MB | 34.4 MB |
| Events in quadrant A | 721,182 | 203,302 |
| Events in quadrant B | 722,266 | 210,985 |
| Events in quadrant C | 732,477 | 205,586 |
| Events in quadrant D | 757,700 | 198,849 |
| Mode M9 | |||
|---|---|---|---|
| Quadrant | BADHDUFLAG | Total packets | Discarded packets |
| A | 0 | 266 | 0 |
| B | 0 | 264 | 0 |
| C | 0 | 262 | 0 |
| D | 0 | 263 | 0 |
| Mode M0 | |||
|---|---|---|---|
| Quadrant | BADHDUFLAG | Total packets | Discarded packets |
| A | 0 | 8322 | 0 |
| B | 0 | 8318 | 0 |
| C | 0 | 8361 | 0 |
| D | 0 | 8348 | 0 |
| Mode SS | |||
|---|---|---|---|
| Quadrant | BADHDUFLAG | Total packets | Discarded packets |
| A | 0 | 80 | 0 |
| B | 0 | 80 | 0 |
| C | 0 | 78 | 0 |
| D | 0 | 80 | 0 |
| Quadrant | Total seconds | Saturated seconds | Saturation percentage |
|---|---|---|---|
| A | 3825 | 244 | 6.379085% |
| B | 3848 | 247 | 6.418919% |
| C | 3830 | 151 | 3.942559% |
| D | 3824 | 169 | 4.419456% |
Noise dominated data is calculated using 1-second bins in cleaned event files. If a bin has >2000 counts, and if more than 50% of those come from <1% of pixels, then it is considered to be noise-dominated and hence unusable.
| Quadrant | # 1 sec bins | Bins with >0 counts | Bins with >2000 counts | High rate bins dominated by noise | Noise dominated (total time) | Noise dominated (detector-on time) | Marked lightcurve |
|---|---|---|---|---|---|---|---|
| A | 3927 | 3919 | 0 | 0 | 0.00% | 0.00% |  |
| B | 3927 | 3915 | 0 | 0 | 0.00% | 0.00% |  |
| C | 3927 | 3917 | 0 | 0 | 0.00% | 0.00% |  |
| D | 3927 | 3912 | 0 | 0 | 0.00% | 0.00% |  |
Top three noisy pixels from each quadrant. If the there are fewer than three noisy pixels in the level2.evt file, extra rows are filled as -1
| Pixel properties | Quadrant properties | ||||||
|---|---|---|---|---|---|---|---|
| Quadrant | DetID | PixID | Counts | Sigma | Mean | Median | Sigma |
| A | 13 | 251 | 12502 | 290.84 | 182 | 177 | 42.4 |
| A | 15 | 239 | 4831 | 109.82 | 182 | 177 | 42.4 |
| A | 12 | 194 | 1263 | 25.63 | 182 | 177 | 42.4 |
| B | 0 | 229 | 3698 | 91.09 | 188 | 182 | 38.6 |
| B | 8 | 61 | 1315 | 29.35 | 188 | 182 | 38.6 |
| B | 0 | 219 | 1057 | 22.67 | 188 | 182 | 38.6 |
| C | 4 | 254 | 16944 | 396.55 | 181 | 176 | 42.3 |
| C | 14 | 67 | 1753 | 37.29 | 181 | 176 | 42.3 |
| C | 9 | 221 | 1114 | 22.18 | 181 | 176 | 42.3 |
| D | 8 | 195 | 33797 | 687.71 | 179 | 171 | 48.9 |
| D | 2 | 16 | 17160 | 347.46 | 179 | 171 | 48.9 |
| D | 2 | 234 | 14582 | 294.73 | 179 | 171 | 48.9 |
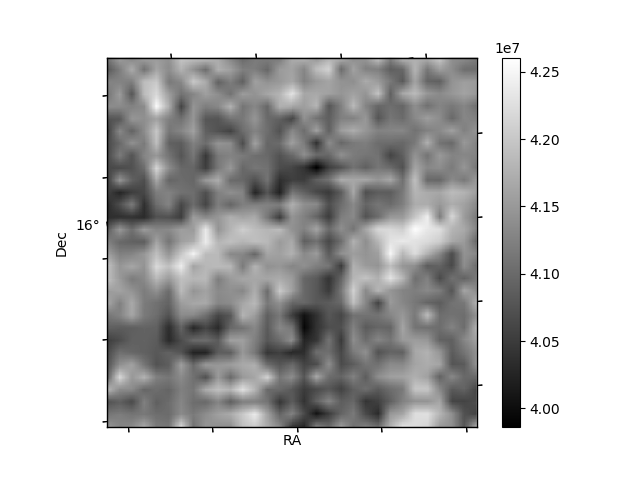
Histogram calculated using DETX and DETY for each event in the final _common_clean file
| Quadrant A |  |
 |
Quadrant B |
|---|---|---|---|
| Quadrant D |  |
 |
Quadrant C |
| Plot type | Count rate plots | Images |
|---|---|---|
| Comparison with Poisson distribution Blue bars denote a histogram of data divided into 1 sec bins. Red curve is a Poisson curve with rate = median count rate of data. |
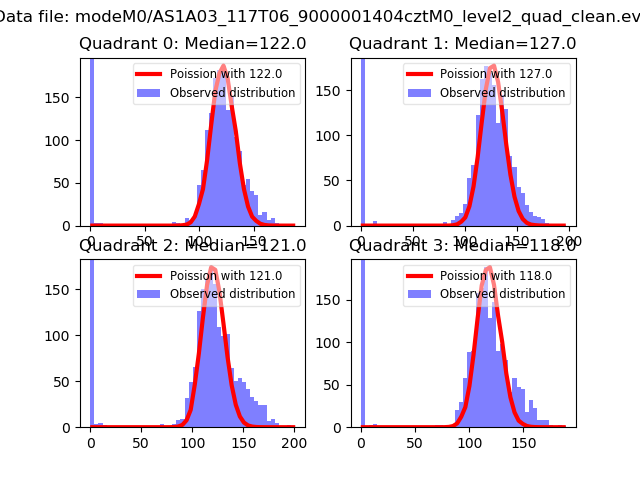 |
 |
| Quadrant-wise count rates Data is divided into 100 sec bins |
 |
|
| Module-wise count rates for Quadrant A Data is divided into 100 sec bins |
 |
 |
| Module-wise count rates for Quadrant B Data is divided into 100 sec bins |
 |
 |
| Module-wise count rates for Quadrant C Data is divided into 100 sec bins |
 |
 |
| Module-wise count rates for Quadrant D Data is divided into 100 sec bins |
 |
 |
| Parameter | Plot |
|---|---|
| CZT HV Monitor | 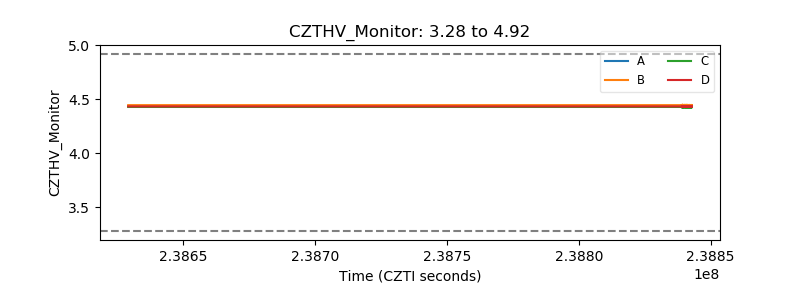 |
| D_VDD |  |
| Temperature 1 |  |
| Veto HV Monitor |  |
| Veto LLD |  |
| Alpha Counter |  |
| _CPM_Rate |  |
| CZT Counter |  |
| +2.5 Volts monitor |  |
| +5 Volts monitor |  |
| _ROLL_ROT | 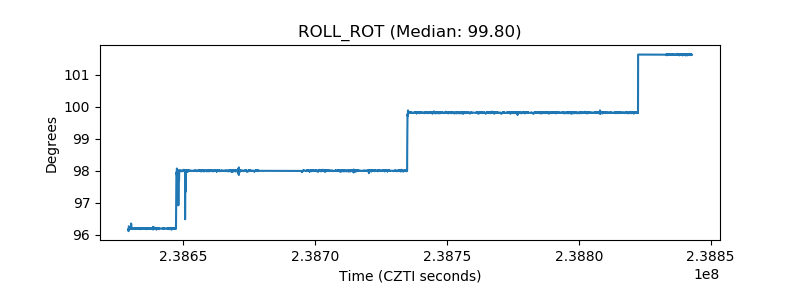 |
| _Roll_DEC |  |
| _Roll_RA |  |
| Veto Counter |  |