| Param | Original file | Final file |
|---|---|---|
| Filename | modeM0/AS1A03_134T01_9000001400cztM0_level2.evt | modeM0/AS1A03_134T01_9000001400cztM0_level2_quad_clean.evt |
| Size (bytes) | 4,067,763,840 | 753,897,600 |
| Size | 3.8 GB | 719.0 MB |
| Events in quadrant A | 26,472,979 | 4,806,493 |
| Events in quadrant B | 27,716,208 | 4,850,501 |
| Events in quadrant C | 26,256,256 | 4,746,230 |
| Events in quadrant D | 38,851,863 | 4,474,022 |
| Mode SS | |||
|---|---|---|---|
| Quadrant | BADHDUFLAG | Total packets | Discarded packets |
| A | 0 | 1178 | 0 |
| B | 0 | 1158 | 0 |
| C | 0 | 1176 | 0 |
| D | 0 | 1178 | 0 |
| Mode M9 | |||
|---|---|---|---|
| Quadrant | BADHDUFLAG | Total packets | Discarded packets |
| A | 0 | 81 | 0 |
| B | 0 | 80 | 0 |
| C | 0 | 80 | 0 |
| D | 0 | 80 | 0 |
| Mode M0 | |||
|---|---|---|---|
| Quadrant | BADHDUFLAG | Total packets | Discarded packets |
| A | 0 | 118799 | 0 |
| B | 0 | 121011 | 0 |
| C | 0 | 118724 | 0 |
| D | 0 | 155058 | 0 |
| Quadrant | Total seconds | Saturated seconds | Saturation percentage |
|---|---|---|---|
| A | 57738 | 1092 | 1.891302% |
| B | 57630 | 1228 | 2.130835% |
| C | 57731 | 873 | 1.512186% |
| D | 57597 | 2802 | 4.864837% |
Noise dominated data is calculated using 1-second bins in cleaned event files. If a bin has >2000 counts, and if more than 50% of those come from <1% of pixels, then it is considered to be noise-dominated and hence unusable.
| Quadrant | # 1 sec bins | Bins with >0 counts | Bins with >2000 counts | High rate bins dominated by noise | Noise dominated (total time) | Noise dominated (detector-on time) | Marked lightcurve |
|---|---|---|---|---|---|---|---|
| A | 68766 | 58819 | 2 | 2 | 0.00% | 0.00% |  |
| B | 68766 | 58721 | 41 | 41 | 0.06% | 0.07% | 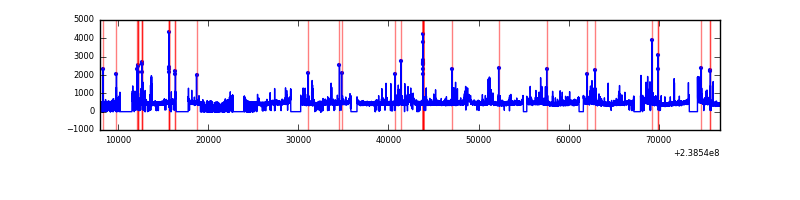 |
| C | 68777 | 58848 | 9 | 9 | 0.01% | 0.02% |  |
| D | 68777 | 58696 | 1423 | 1423 | 2.07% | 2.42% |  |
Top three noisy pixels from each quadrant. If the there are fewer than three noisy pixels in the level2.evt file, extra rows are filled as -1
| Pixel properties | Quadrant properties | ||||||
|---|---|---|---|---|---|---|---|
| Quadrant | DetID | PixID | Counts | Sigma | Mean | Median | Sigma |
| A | 14 | 111 | 76756 | 51.14 | 6841 | 6698 | 1370.0 |
| A | 0 | 226 | 62170 | 40.49 | 6841 | 6698 | 1370.0 |
| A | 12 | 194 | 54347 | 34.78 | 6841 | 6698 | 1370.0 |
| B | 4 | 81 | 327489 | 248.76 | 6861 | 6690 | 1289.6 |
| B | 0 | 214 | 236536 | 178.23 | 6861 | 6690 | 1289.6 |
| B | 0 | 229 | 195451 | 146.37 | 6861 | 6690 | 1289.6 |
| C | 4 | 254 | 111943 | 68.9 | 6661 | 6678 | 1527.8 |
| C | 10 | 22 | 57650 | 33.36 | 6661 | 6678 | 1527.8 |
| C | 13 | 61 | 49946 | 28.32 | 6661 | 6678 | 1527.8 |
| D | 1 | 52 | 9232053 | 5641.4 | 6496 | 6349 | 1635.4 |
| D | 2 | 16 | 2416565 | 1473.82 | 6496 | 6349 | 1635.4 |
| D | 12 | 233 | 907308 | 550.93 | 6496 | 6349 | 1635.4 |
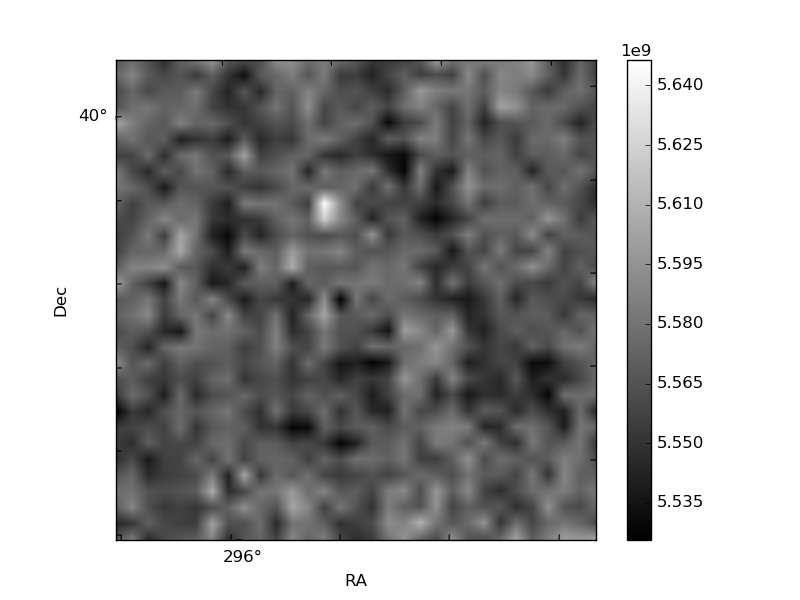
Histogram calculated using DETX and DETY for each event in the final _common_clean file
| Quadrant A |  |
 |
Quadrant B |
|---|---|---|---|
| Quadrant D |  |
 |
Quadrant C |
| Plot type | Count rate plots | Images |
|---|---|---|
| Comparison with Poisson distribution Blue bars denote a histogram of data divided into 1 sec bins. Red curve is a Poisson curve with rate = median count rate of data. |
 |
 |
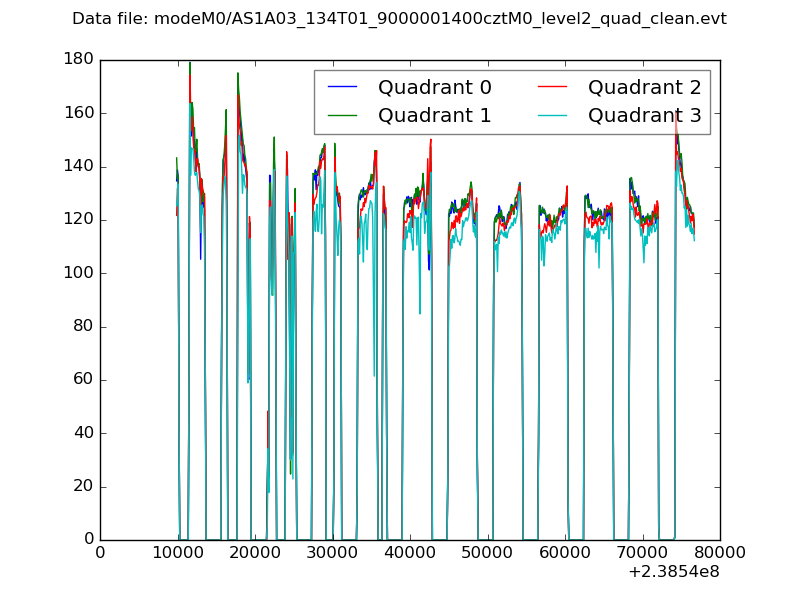
| Quadrant-wise count rates Data is divided into 100 sec bins |
 |
|
| Module-wise count rates for Quadrant A Data is divided into 100 sec bins |
 |
 |
| Module-wise count rates for Quadrant B Data is divided into 100 sec bins |
 |
 |
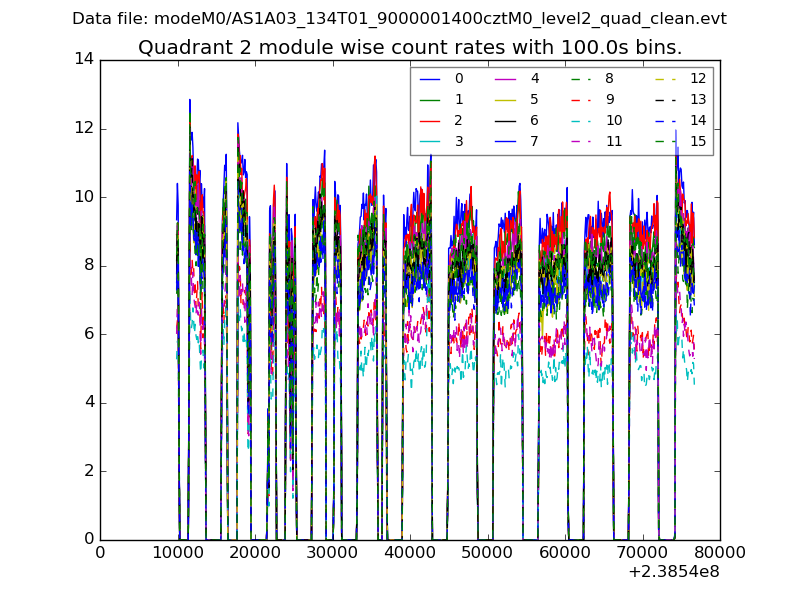
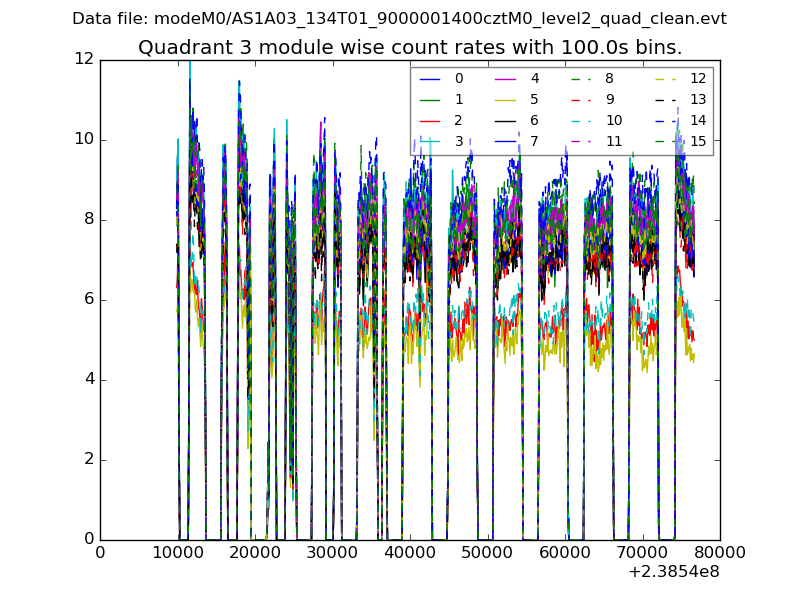
| Module-wise count rates for Quadrant C Data is divided into 100 sec bins |
 |
 |
| Module-wise count rates for Quadrant D Data is divided into 100 sec bins |
 |
 |
| Parameter | Plot |
|---|---|
| CZT HV Monitor | 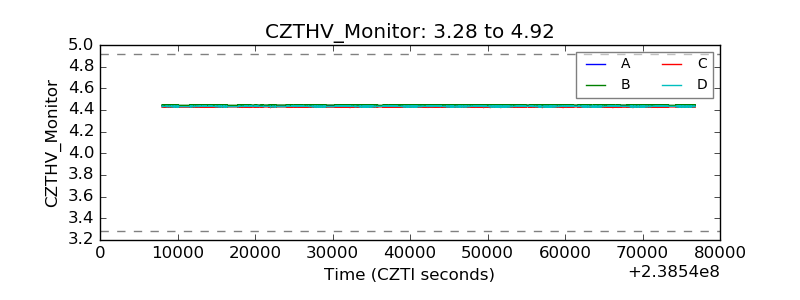 |
| D_VDD |  |
| Temperature 1 |  |
| Veto HV Monitor |  |
| Veto LLD | 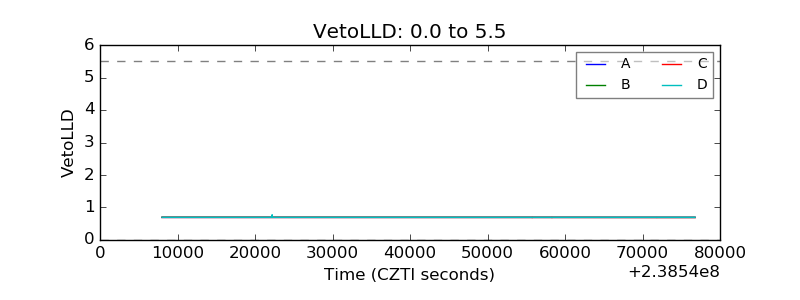 |
| Alpha Counter | 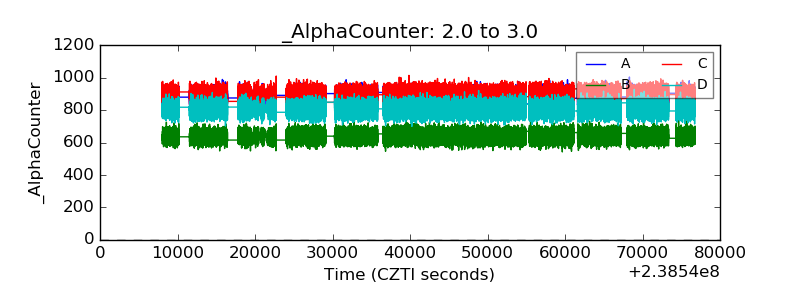 |
| _CPM_Rate | 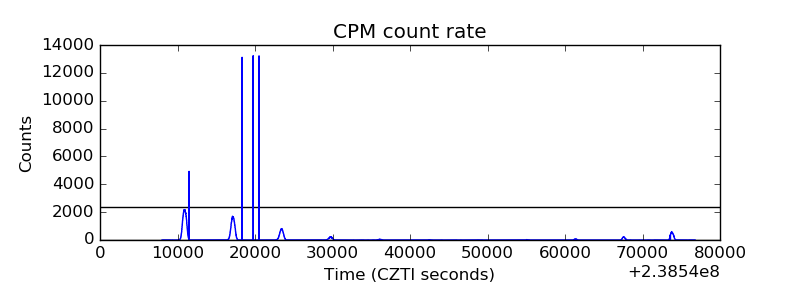 |
| CZT Counter |  |
| +2.5 Volts monitor |  |
| +5 Volts monitor |  |
| _ROLL_ROT | 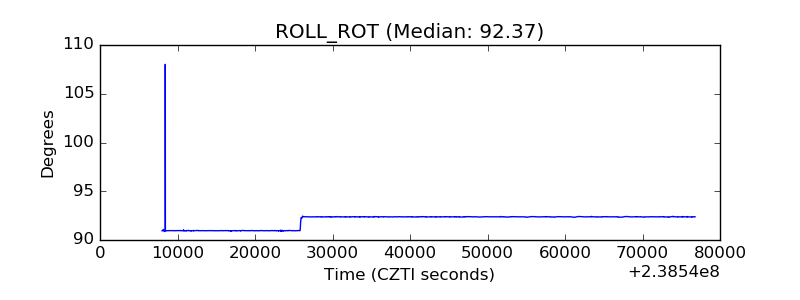 |
| _Roll_DEC |  |
| _Roll_RA |  |
| Veto Counter |  |