| Param | Original file | Final file |
|---|---|---|
| Filename | modeM0/AS1G07_020T01_9000001398cztM0_level2.evt | modeM0/AS1G07_020T01_9000001398cztM0_level2_quad_clean.evt |
| Size (bytes) | 6,867,754,560 | 1,120,662,720 |
| Size | 6.4 GB | 1.0 GB |
| Events in quadrant A | 43,761,634 | 6,962,900 |
| Events in quadrant B | 48,044,090 | 7,045,398 |
| Events in quadrant C | 43,299,374 | 6,993,052 |
| Events in quadrant D | 66,535,364 | 6,485,606 |
| Mode M9 | |||
|---|---|---|---|
| Quadrant | BADHDUFLAG | Total packets | Discarded packets |
| A | 0 | 157 | 0 |
| B | 0 | 157 | 0 |
| C | 0 | 157 | 0 |
| D | 0 | 156 | 0 |
| Mode SS | |||
|---|---|---|---|
| Quadrant | BADHDUFLAG | Total packets | Discarded packets |
| A | 0 | 1922 | 0 |
| B | 0 | 1916 | 0 |
| C | 0 | 1924 | 0 |
| D | 0 | 1922 | 0 |
| Mode M0 | |||
|---|---|---|---|
| Quadrant | BADHDUFLAG | Total packets | Discarded packets |
| A | 0 | 194440 | 0 |
| B | 0 | 204203 | 0 |
| C | 0 | 194065 | 0 |
| D | 0 | 262775 | 0 |
| Quadrant | Total seconds | Saturated seconds | Saturation percentage |
|---|---|---|---|
| A | 94297 | 1103 | 1.169708% |
| B | 94071 | 1593 | 1.693402% |
| C | 94274 | 821 | 0.870866% |
| D | 94085 | 3699 | 3.931551% |
Noise dominated data is calculated using 1-second bins in cleaned event files. If a bin has >2000 counts, and if more than 50% of those come from <1% of pixels, then it is considered to be noise-dominated and hence unusable.
| Quadrant | # 1 sec bins | Bins with >0 counts | Bins with >2000 counts | High rate bins dominated by noise | Noise dominated (total time) | Noise dominated (detector-on time) | Marked lightcurve |
|---|---|---|---|---|---|---|---|
| A | 111006 | 94898 | 38 | 38 | 0.03% | 0.04% |  |
| B | 111006 | 94746 | 198 | 198 | 0.18% | 0.21% |  |
| C | 111006 | 94910 | 46 | 46 | 0.04% | 0.05% |  |
| D | 111006 | 94809 | 2656 | 2656 | 2.39% | 2.80% |  |
Top three noisy pixels from each quadrant. If the there are fewer than three noisy pixels in the level2.evt file, extra rows are filled as -1
| Pixel properties | Quadrant properties | ||||||
|---|---|---|---|---|---|---|---|
| Quadrant | DetID | PixID | Counts | Sigma | Mean | Median | Sigma |
| A | 14 | 111 | 153470 | 63.07 | 11219 | 10998 | 2258.8 |
| A | 8 | 15 | 121191 | 48.78 | 11219 | 10998 | 2258.8 |
| A | 0 | 226 | 103580 | 40.99 | 11219 | 10998 | 2258.8 |
| B | 4 | 239 | 775923 | 359.48 | 11291 | 11029 | 2127.8 |
| B | 0 | 214 | 692450 | 320.25 | 11291 | 11029 | 2127.8 |
| B | 4 | 173 | 681223 | 314.98 | 11291 | 11029 | 2127.8 |
| C | 10 | 22 | 310681 | 118.74 | 10942 | 10990 | 2523.9 |
| C | 0 | 207 | 123913 | 44.74 | 10942 | 10990 | 2523.9 |
| C | 14 | 234 | 102548 | 36.28 | 10942 | 10990 | 2523.9 |
| D | 5 | 113 | 6690184 | 2610.37 | 10656 | 10414 | 2558.9 |
| D | 1 | 52 | 5598371 | 2183.7 | 10656 | 10414 | 2558.9 |
| D | 7 | 46 | 3622671 | 1411.62 | 10656 | 10414 | 2558.9 |
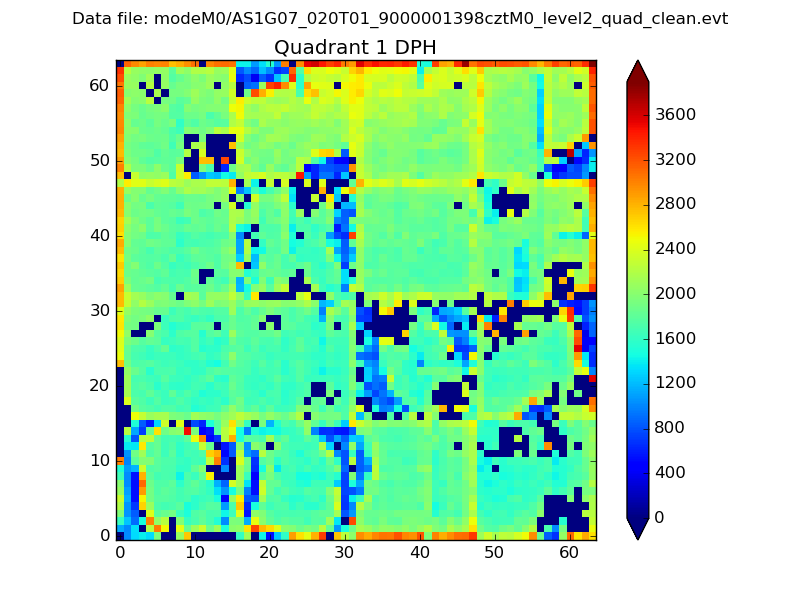
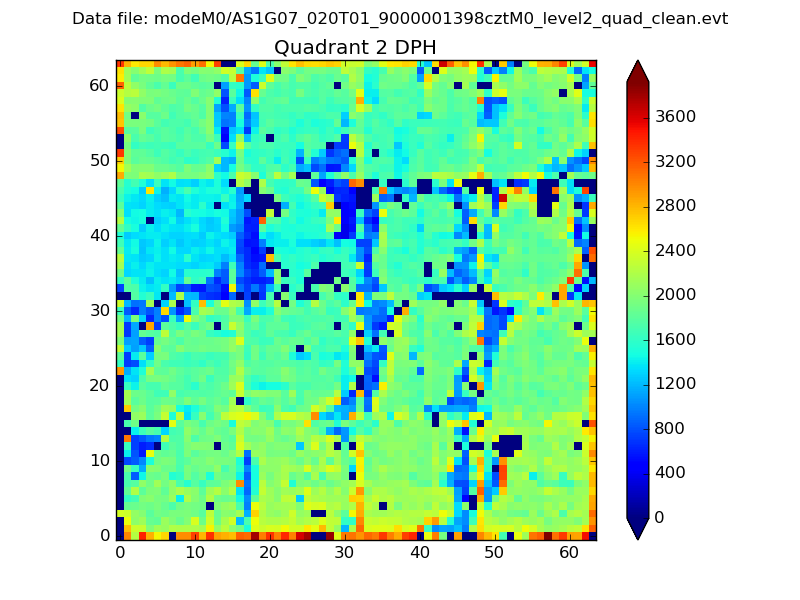
Histogram calculated using DETX and DETY for each event in the final _common_clean file
| Quadrant A |  |
 |
Quadrant B |
|---|---|---|---|
| Quadrant D |  |
 |
Quadrant C |
| Plot type | Count rate plots | Images |
|---|---|---|
| Comparison with Poisson distribution Blue bars denote a histogram of data divided into 1 sec bins. Red curve is a Poisson curve with rate = median count rate of data. |
 |
 |
| Quadrant-wise count rates Data is divided into 100 sec bins |
 |
|
| Module-wise count rates for Quadrant A Data is divided into 100 sec bins |
 |
 |
| Module-wise count rates for Quadrant B Data is divided into 100 sec bins |
 |
 |
| Module-wise count rates for Quadrant C Data is divided into 100 sec bins |
 |
 |
| Module-wise count rates for Quadrant D Data is divided into 100 sec bins |
 |
 |
| Parameter | Plot |
|---|---|
| CZT HV Monitor |  |
| D_VDD | 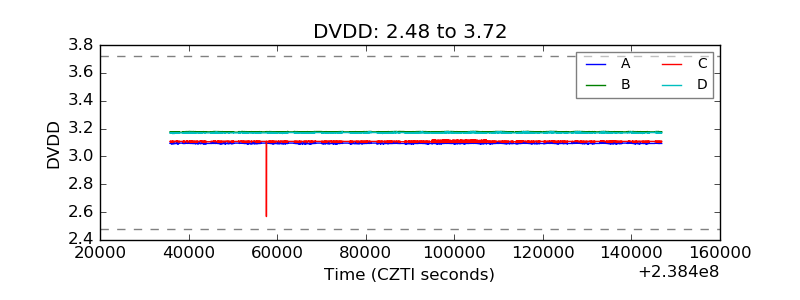 |
| Temperature 1 |  |
| Veto HV Monitor |  |
| Veto LLD | 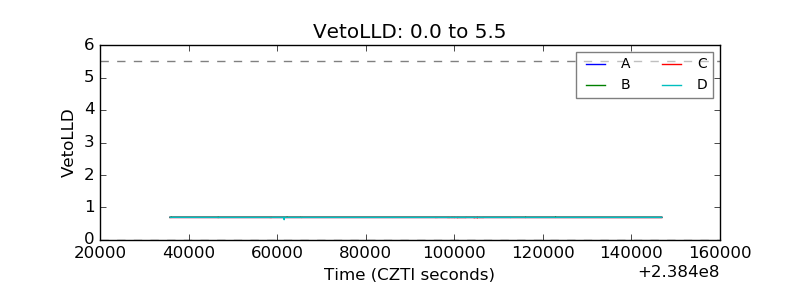 |
| Alpha Counter | 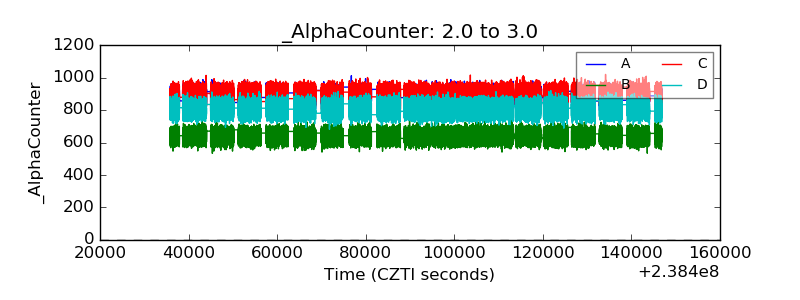 |
| _CPM_Rate |  |
| CZT Counter |  |
| +2.5 Volts monitor |  |
| +5 Volts monitor |  |
| _ROLL_ROT |  |
| _Roll_DEC |  |
| _Roll_RA | 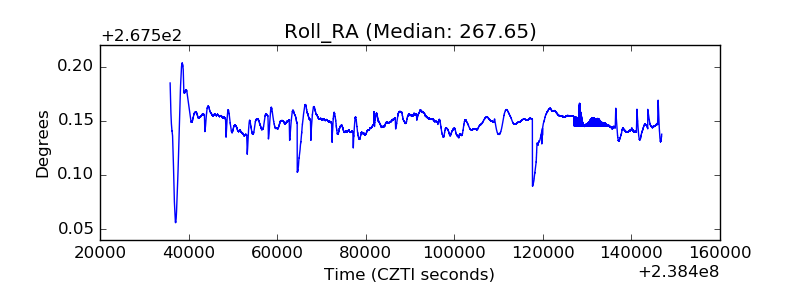 |
| Veto Counter |  |