| Param | Original file | Final file |
|---|---|---|
| Filename | modeM0/AS1G05_218T01_9000001394cztM0_level2_bc.evt | modeM0/AS1G05_218T01_9000001394cztM0_level2_quad_clean.evt |
| Size (bytes) | 5,074,571,520 | 1,774,843,200 |
| Size | 4.7 GB | 1.7 GB |
| Events in quadrant A | 29,430,204 | 11,069,916 |
| Events in quadrant B | 30,528,875 | 11,271,172 |
| Events in quadrant C | 28,932,043 | 10,960,344 |
| Events in quadrant D | 54,813,060 | 10,423,006 |
| Mode SS | |||
|---|---|---|---|
| Quadrant | BADHDUFLAG | Total packets | Discarded packets |
| A | 0 | 2990 | 0 |
| B | 0 | 3017 | 0 |
| C | 0 | 2990 | 0 |
| D | 0 | 2978 | 0 |
| Mode M0 | |||
|---|---|---|---|
| Quadrant | BADHDUFLAG | Total packets | Discarded packets |
| A | 0 | 303768 | 0 |
| B | 0 | 307559 | 0 |
| C | 0 | 302762 | 0 |
| D | 0 | 400289 | 0 |
| Mode M9 | |||
|---|---|---|---|
| Quadrant | BADHDUFLAG | Total packets | Discarded packets |
| A | 0 | 226 | 0 |
| B | 0 | 228 | 0 |
| C | 0 | 227 | 0 |
| D | 0 | 228 | 0 |
| Quadrant | Total seconds | Saturated seconds | Saturation percentage |
|---|---|---|---|
| A | 146622 | 1976 | 1.347683% |
| B | 146529 | 2339 | 1.596271% |
| C | 146516 | 1482 | 1.011494% |
| D | 145810 | 6399 | 4.388588% |
Noise dominated data is calculated using 1-second bins in cleaned event files. If a bin has >2000 counts, and if more than 50% of those come from <1% of pixels, then it is considered to be noise-dominated and hence unusable.
| Quadrant | # 1 sec bins | Bins with >0 counts | Bins with >2000 counts | High rate bins dominated by noise | Noise dominated (total time) | Noise dominated (detector-on time) | Marked lightcurve |
|---|---|---|---|---|---|---|---|
| A | 191058 | 149595 | 35 | 35 | 0.02% | 0.02% |  |
| B | 191058 | 149558 | 14 | 14 | 0.01% | 0.01% | 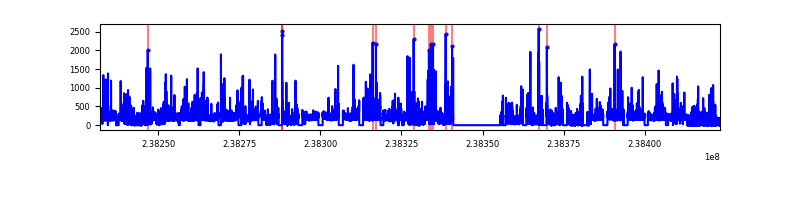 |
| C | 191058 | 149535 | 19 | 19 | 0.01% | 0.01% | 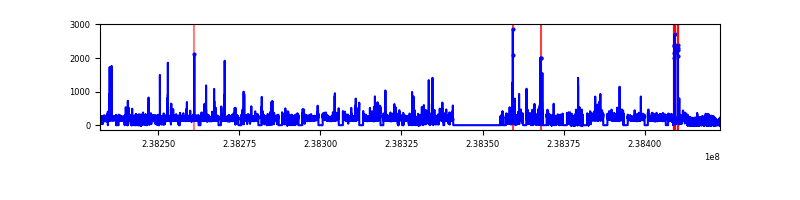 |
| D | 191058 | 149049 | 596 | 596 | 0.31% | 0.40% |  |
Top three noisy pixels from each quadrant. If the there are fewer than three noisy pixels in the level2.evt file, extra rows are filled as -1
| Pixel properties | Quadrant properties | ||||||
|---|---|---|---|---|---|---|---|
| Quadrant | DetID | PixID | Counts | Sigma | Mean | Median | Sigma |
| A | 8 | 15 | 231565 | 139.02 | 7422 | 7270 | 1613.4 |
| A | 12 | 210 | 221496 | 132.78 | 7422 | 7270 | 1613.4 |
| A | 1 | 162 | 142814 | 84.01 | 7422 | 7270 | 1613.4 |
| B | 0 | 214 | 448674 | 312.75 | 7486 | 7281 | 1411.3 |
| B | 4 | 239 | 322213 | 223.15 | 7486 | 7281 | 1411.3 |
| B | 0 | 85 | 146843 | 98.89 | 7486 | 7281 | 1411.3 |
| C | 10 | 22 | 209039 | 128.88 | 7214 | 7106 | 1566.8 |
| C | 14 | 234 | 146908 | 89.23 | 7214 | 7106 | 1566.8 |
| C | 1 | 3 | 114140 | 68.31 | 7214 | 7106 | 1566.8 |
| D | 1 | 52 | 18795865 | 10489.96 | 7076 | 6860 | 1791.1 |
| D | 2 | 152 | 2728960 | 1519.76 | 7076 | 6860 | 1791.1 |
| D | 12 | 233 | 1421232 | 789.65 | 7076 | 6860 | 1791.1 |
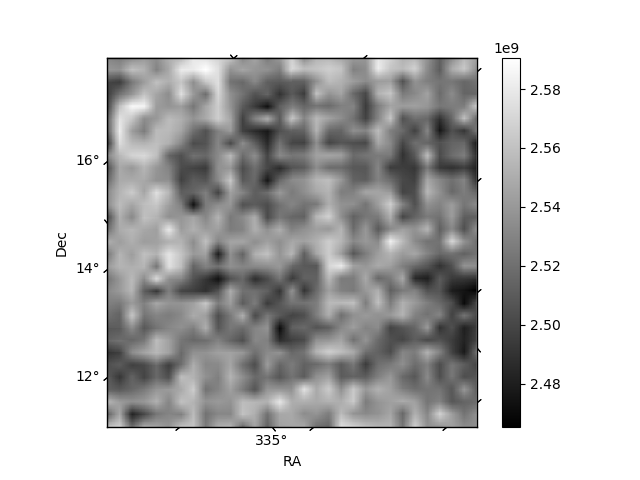
Histogram calculated using DETX and DETY for each event in the final _common_clean file
| Quadrant A |  |
 |
Quadrant B |
|---|---|---|---|
| Quadrant D | 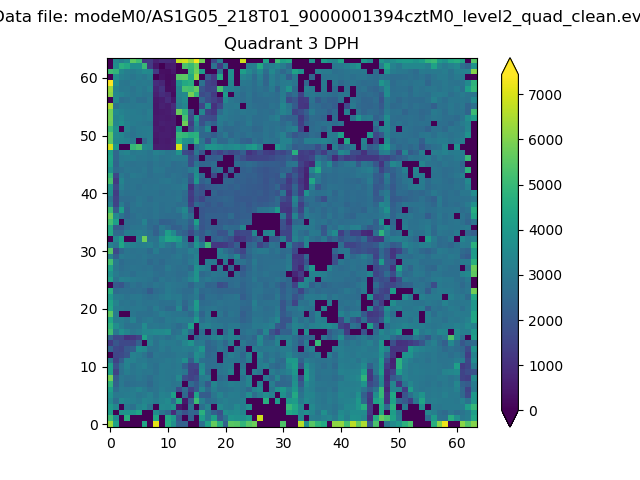 |
 |
Quadrant C |
| Plot type | Count rate plots | Images |
|---|---|---|
| Comparison with Poisson distribution Blue bars denote a histogram of data divided into 1 sec bins. Red curve is a Poisson curve with rate = median count rate of data. |
 |
 |
| Quadrant-wise count rates Data is divided into 100 sec bins |
 |
|
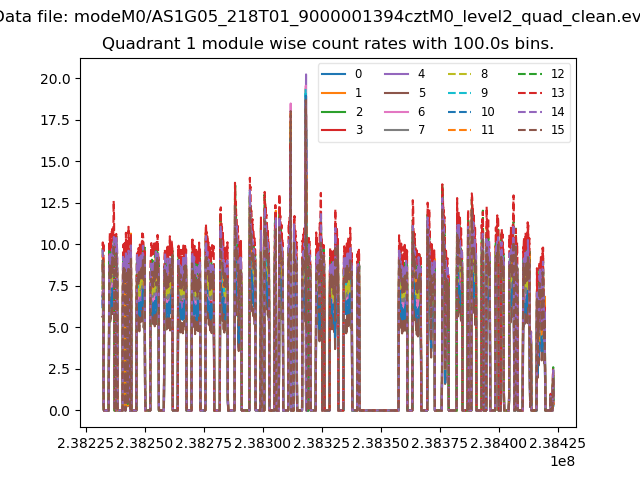
| Module-wise count rates for Quadrant A Data is divided into 100 sec bins |
 |
 |
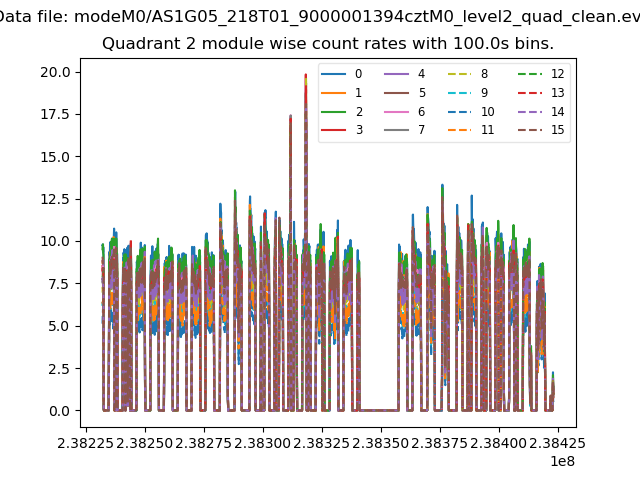
| Module-wise count rates for Quadrant B Data is divided into 100 sec bins |
 |
 |
| Module-wise count rates for Quadrant C Data is divided into 100 sec bins |
 |
 |
| Module-wise count rates for Quadrant D Data is divided into 100 sec bins |
 |
 |
| Parameter | Plot |
|---|---|
| CZT HV Monitor |  |
| D_VDD |  |
| Temperature 1 |  |
| Veto HV Monitor |  |
| Veto LLD |  |
| Alpha Counter |  |
| _CPM_Rate | 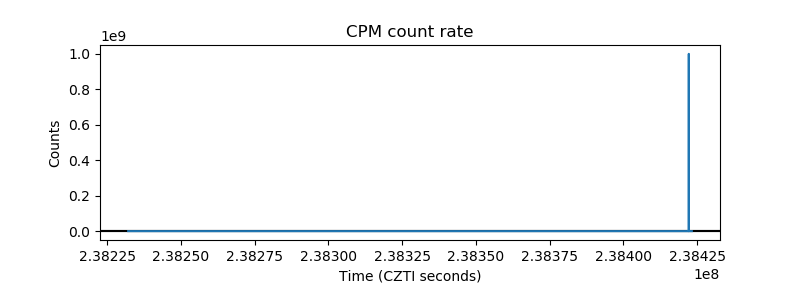 |
| CZT Counter | 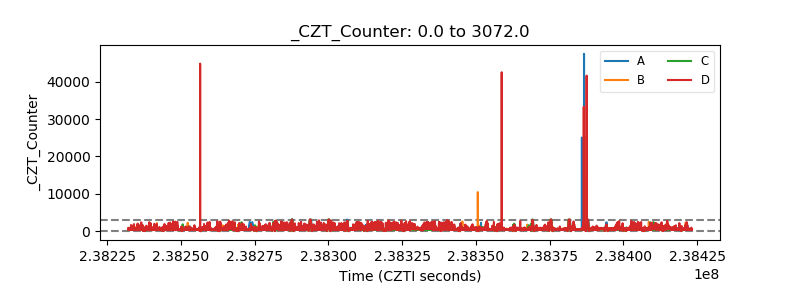 |
| +2.5 Volts monitor |  |
| +5 Volts monitor |  |
| _ROLL_ROT |  |
| _Roll_DEC | 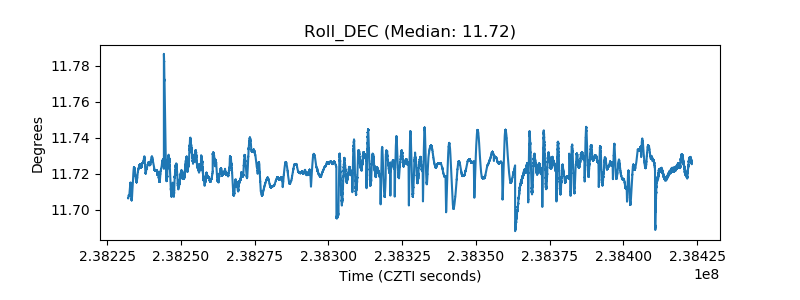 |
| _Roll_RA |  |
| Veto Counter |  |