| Param | Original file | Final file |
|---|---|---|
| Filename | modeM0/AS1A03_080T01_9000001392cztM0_level2.evt | modeM0/AS1A03_080T01_9000001392cztM0_level2_quad_clean.evt |
| Size (bytes) | 785,796,480 | 130,950,720 |
| Size | 749.4 MB | 124.9 MB |
| Events in quadrant A | 5,370,753 | 794,903 |
| Events in quadrant B | 5,705,881 | 811,704 |
| Events in quadrant C | 5,475,368 | 814,519 |
| Events in quadrant D | 6,490,683 | 772,678 |
| Mode M0 | |||
|---|---|---|---|
| Quadrant | BADHDUFLAG | Total packets | Discarded packets |
| A | 0 | 22846 | 0 |
| B | 0 | 23687 | 0 |
| C | 0 | 23181 | 0 |
| D | 0 | 26670 | 0 |
| Mode SS | |||
|---|---|---|---|
| Quadrant | BADHDUFLAG | Total packets | Discarded packets |
| A | 0 | 228 | 0 |
| B | 0 | 228 | 0 |
| C | 0 | 228 | 0 |
| D | 0 | 228 | 0 |
| Mode M9 | |||
|---|---|---|---|
| Quadrant | BADHDUFLAG | Total packets | Discarded packets |
| A | 0 | 34 | 0 |
| B | 0 | 34 | 0 |
| C | 0 | 34 | 0 |
| D | 0 | 35 | 0 |
| Quadrant | Total seconds | Saturated seconds | Saturation percentage |
|---|---|---|---|
| A | 11150 | 93 | 0.834081% |
| B | 11150 | 162 | 1.452915% |
| C | 11150 | 109 | 0.977578% |
| D | 11150 | 200 | 1.793722% |
Noise dominated data is calculated using 1-second bins in cleaned event files. If a bin has >2000 counts, and if more than 50% of those come from <1% of pixels, then it is considered to be noise-dominated and hence unusable.
| Quadrant | # 1 sec bins | Bins with >0 counts | Bins with >2000 counts | High rate bins dominated by noise | Noise dominated (total time) | Noise dominated (detector-on time) | Marked lightcurve |
|---|---|---|---|---|---|---|---|
| A | 13770 | 11152 | 0 | 0 | 0.00% | 0.00% | 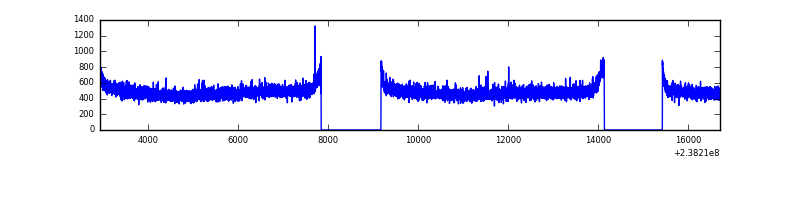 |
| B | 13770 | 11152 | 26 | 26 | 0.19% | 0.23% |  |
| C | 13770 | 11152 | 17 | 17 | 0.12% | 0.15% |  |
| D | 13770 | 11152 | 79 | 79 | 0.57% | 0.71% |  |
Top three noisy pixels from each quadrant. If the there are fewer than three noisy pixels in the level2.evt file, extra rows are filled as -1
| Pixel properties | Quadrant properties | ||||||
|---|---|---|---|---|---|---|---|
| Quadrant | DetID | PixID | Counts | Sigma | Mean | Median | Sigma |
| A | 13 | 251 | 15328 | 50.75 | 1387 | 1358 | 275.3 |
| A | 0 | 226 | 12866 | 41.81 | 1387 | 1358 | 275.3 |
| A | 12 | 194 | 11202 | 35.76 | 1387 | 1358 | 275.3 |
| B | 4 | 239 | 146362 | 560.12 | 1399 | 1366 | 258.9 |
| B | 0 | 214 | 49853 | 187.31 | 1399 | 1366 | 258.9 |
| B | 0 | 187 | 35694 | 132.61 | 1399 | 1366 | 258.9 |
| C | 14 | 234 | 123707 | 391.58 | 1371 | 1382 | 312.4 |
| C | 13 | 61 | 10359 | 28.74 | 1371 | 1382 | 312.4 |
| C | 14 | 67 | 5106 | 11.92 | 1371 | 1382 | 312.4 |
| D | 1 | 52 | 562689 | 1744.59 | 1347 | 1317 | 321.8 |
| D | 2 | 152 | 344097 | 1065.27 | 1347 | 1317 | 321.8 |
| D | 2 | 14 | 139134 | 428.3 | 1347 | 1317 | 321.8 |
Histogram calculated using DETX and DETY for each event in the final _common_clean file
| Quadrant A |  |
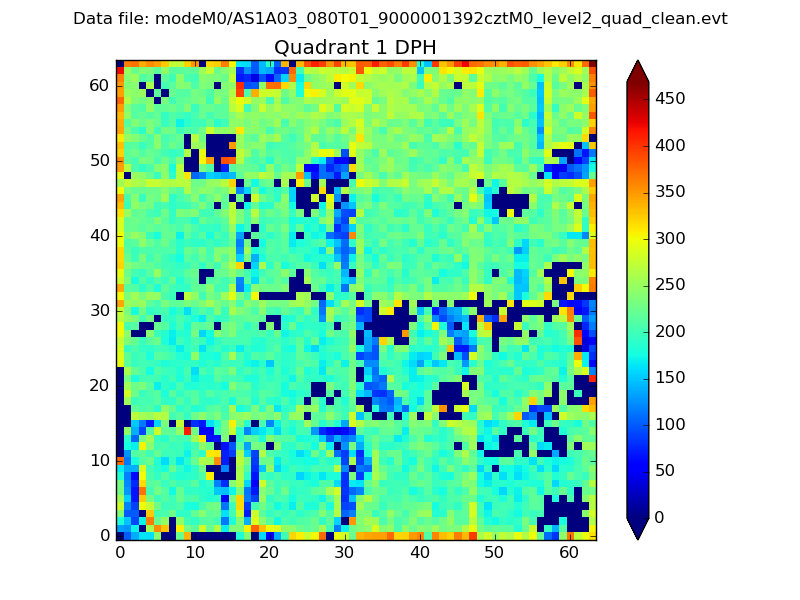 |
Quadrant B |
|---|---|---|---|
| Quadrant D |  |
 |
Quadrant C |
| Plot type | Count rate plots | Images |
|---|---|---|
| Comparison with Poisson distribution Blue bars denote a histogram of data divided into 1 sec bins. Red curve is a Poisson curve with rate = median count rate of data. |
 |
 |
| Quadrant-wise count rates Data is divided into 100 sec bins |
 |
|
| Module-wise count rates for Quadrant A Data is divided into 100 sec bins |
 |
 |
| Module-wise count rates for Quadrant B Data is divided into 100 sec bins |
 |
 |
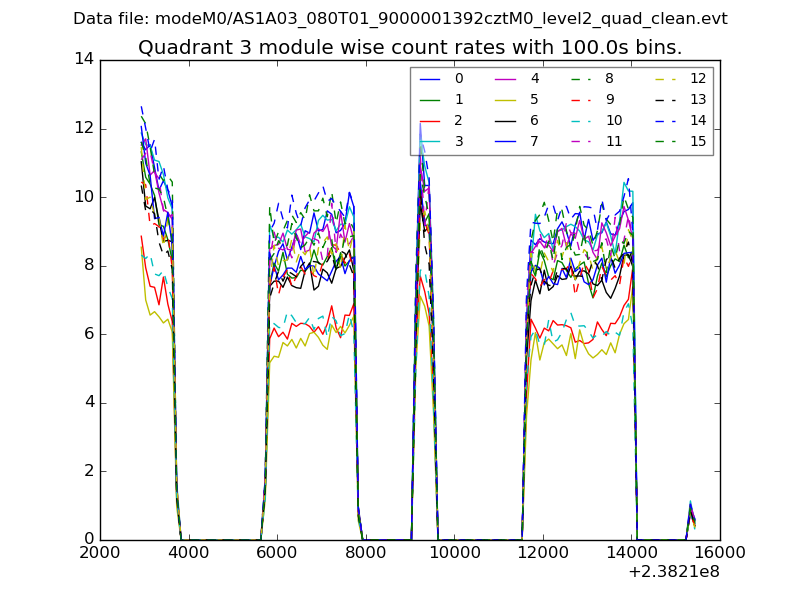
| Module-wise count rates for Quadrant C Data is divided into 100 sec bins |
 |
 |
| Module-wise count rates for Quadrant D Data is divided into 100 sec bins |
 |
 |
| Parameter | Plot |
|---|---|
| CZT HV Monitor |  |
| D_VDD |  |
| Temperature 1 |  |
| Veto HV Monitor | 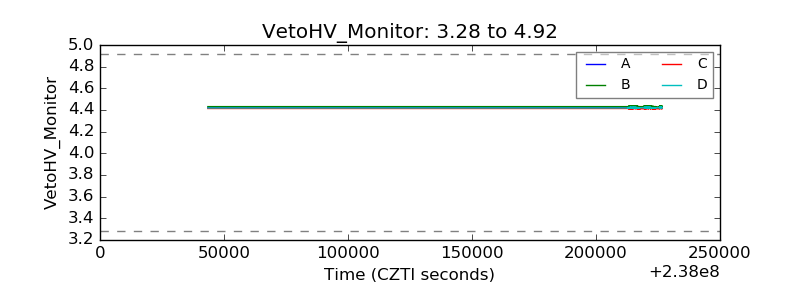 |
| Veto LLD |  |
| Alpha Counter |  |
| _CPM_Rate |  |
| CZT Counter |  |
| +2.5 Volts monitor |  |
| +5 Volts monitor | 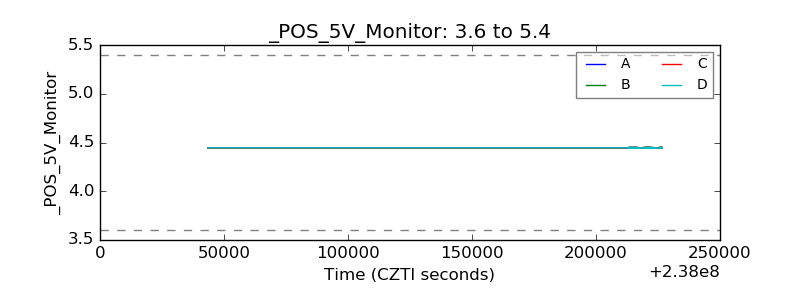 |
| _ROLL_ROT |  |
| _Roll_DEC |  |
| _Roll_RA |  |
| Veto Counter |  |