| Param | Original file | Final file |
|---|---|---|
| Filename | modeM0/AS1A03_114T01_9000001390cztM0_level2.evt | modeM0/AS1A03_114T01_9000001390cztM0_level2_quad_clean.evt |
| Size (bytes) | 320,794,560 | 59,616,000 |
| Size | 305.9 MB | 56.9 MB |
| Events in quadrant A | 2,304,943 | 367,498 |
| Events in quadrant B | 2,339,013 | 378,370 |
| Events in quadrant C | 2,261,690 | 364,415 |
| Events in quadrant D | 2,467,935 | 343,588 |
| Mode M9 | |||
|---|---|---|---|
| Quadrant | BADHDUFLAG | Total packets | Discarded packets |
| A | 0 | 11 | 0 |
| B | 0 | 11 | 0 |
| C | 0 | 11 | 0 |
| D | 0 | 11 | 0 |
| Mode M0 | |||
|---|---|---|---|
| Quadrant | BADHDUFLAG | Total packets | Discarded packets |
| A | 0 | 10201 | 0 |
| B | 0 | 10258 | 0 |
| C | 0 | 10191 | 0 |
| D | 0 | 10962 | 0 |
| Mode SS | |||
|---|---|---|---|
| Quadrant | BADHDUFLAG | Total packets | Discarded packets |
| A | 0 | 102 | 0 |
| B | 0 | 102 | 0 |
| C | 0 | 102 | 0 |
| D | 0 | 102 | 0 |
| Quadrant | Total seconds | Saturated seconds | Saturation percentage |
|---|---|---|---|
| A | 5009 | 17 | 0.339389% |
| B | 5009 | 21 | 0.419245% |
| C | 5009 | 15 | 0.299461% |
| D | 5009 | 95 | 1.896586% |
Noise dominated data is calculated using 1-second bins in cleaned event files. If a bin has >2000 counts, and if more than 50% of those come from <1% of pixels, then it is considered to be noise-dominated and hence unusable.
| Quadrant | # 1 sec bins | Bins with >0 counts | Bins with >2000 counts | High rate bins dominated by noise | Noise dominated (total time) | Noise dominated (detector-on time) | Marked lightcurve |
|---|---|---|---|---|---|---|---|
| A | 6104 | 5010 | 0 | 0 | 0.00% | 0.00% | 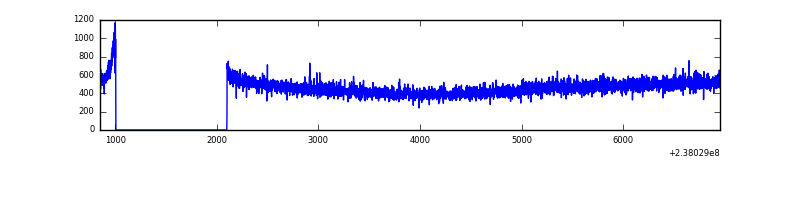 |
| B | 6104 | 5010 | 0 | 0 | 0.00% | 0.00% | 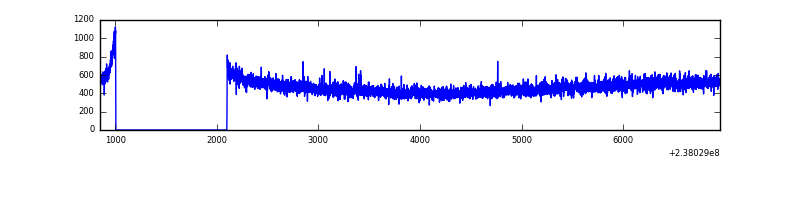 |
| C | 6104 | 5010 | 0 | 0 | 0.00% | 0.00% |  |
| D | 6104 | 5010 | 82 | 82 | 1.34% | 1.64% |  |
Top three noisy pixels from each quadrant. If the there are fewer than three noisy pixels in the level2.evt file, extra rows are filled as -1
| Pixel properties | Quadrant properties | ||||||
|---|---|---|---|---|---|---|---|
| Quadrant | DetID | PixID | Counts | Sigma | Mean | Median | Sigma |
| A | 14 | 111 | 6554 | 49.29 | 595 | 583 | 121.1 |
| A | 0 | 226 | 5331 | 39.2 | 595 | 583 | 121.1 |
| A | 13 | 251 | 5051 | 36.89 | 595 | 583 | 121.1 |
| B | 12 | 111 | 13631 | 113.2 | 599 | 587 | 115.2 |
| B | 11 | 111 | 11166 | 91.81 | 599 | 587 | 115.2 |
| B | 14 | 111 | 9149 | 74.3 | 599 | 587 | 115.2 |
| C | 13 | 61 | 4332 | 27.83 | 578 | 580 | 134.8 |
| C | 8 | 222 | 2726 | 15.92 | 578 | 580 | 134.8 |
| C | 9 | 237 | 1841 | 9.35 | 578 | 580 | 134.8 |
| D | 13 | 137 | 161262 | 1093.93 | 564 | 554 | 146.9 |
| D | 1 | 52 | 118850 | 805.24 | 564 | 554 | 146.9 |
| D | 2 | 234 | 15104 | 99.04 | 564 | 554 | 146.9 |
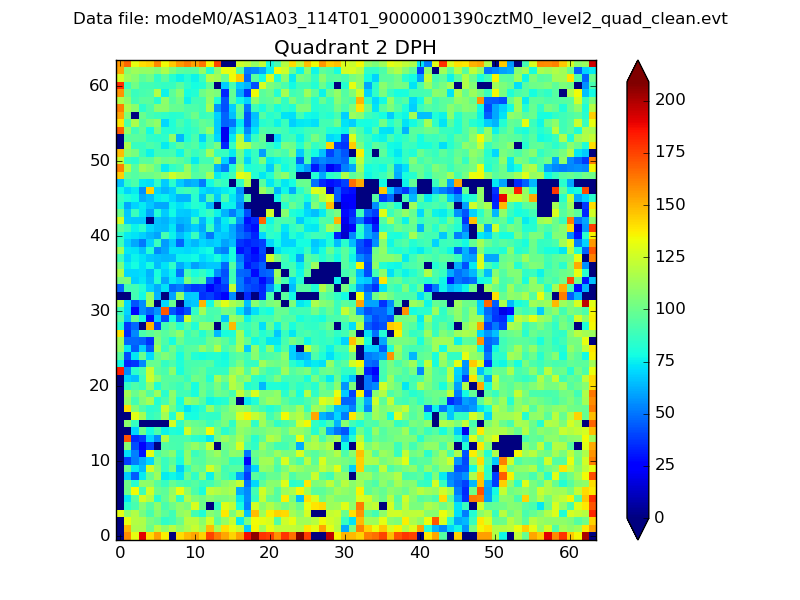
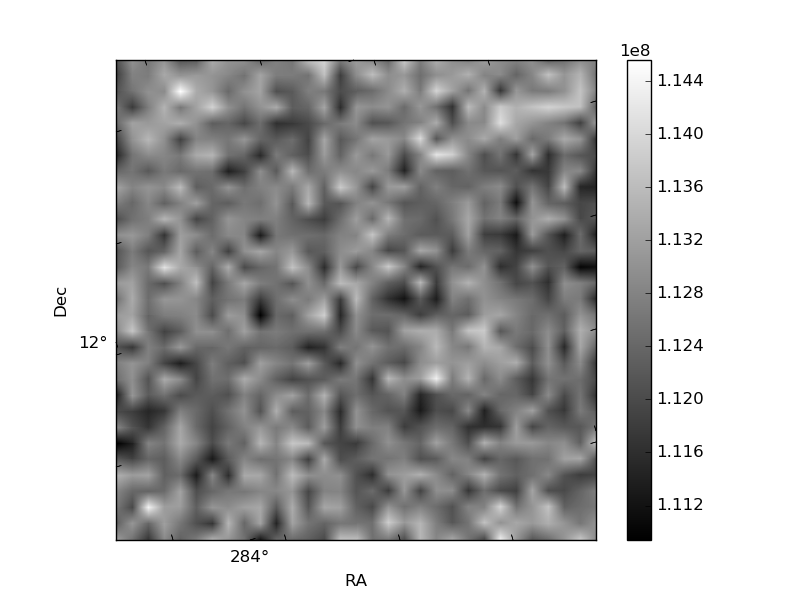
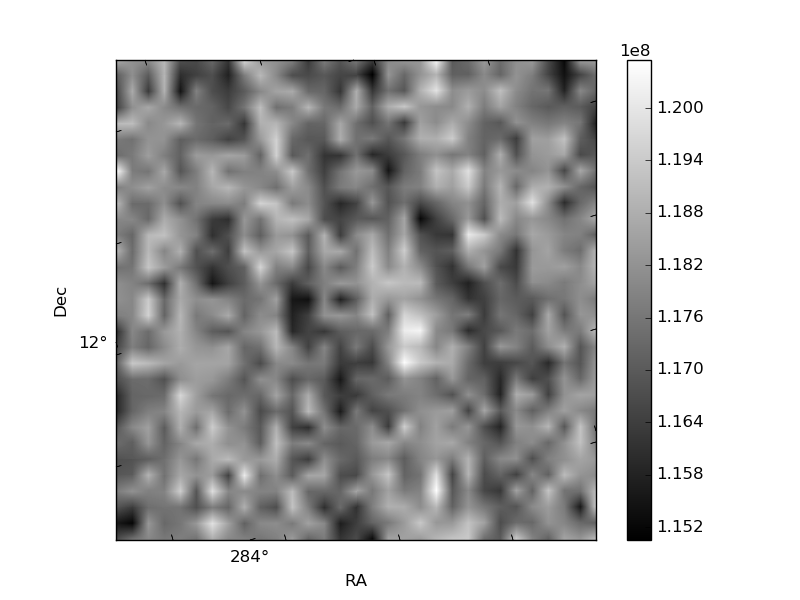
Histogram calculated using DETX and DETY for each event in the final _common_clean file
| Quadrant A |  |
 |
Quadrant B |
|---|---|---|---|
| Quadrant D |  |
 |
Quadrant C |
| Plot type | Count rate plots | Images |
|---|---|---|
| Comparison with Poisson distribution Blue bars denote a histogram of data divided into 1 sec bins. Red curve is a Poisson curve with rate = median count rate of data. |
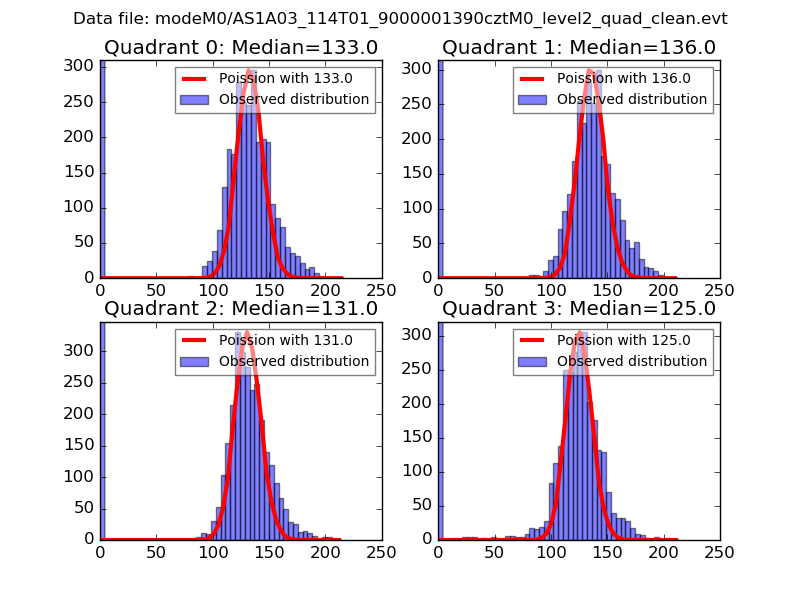 |
 |
| Quadrant-wise count rates Data is divided into 100 sec bins |
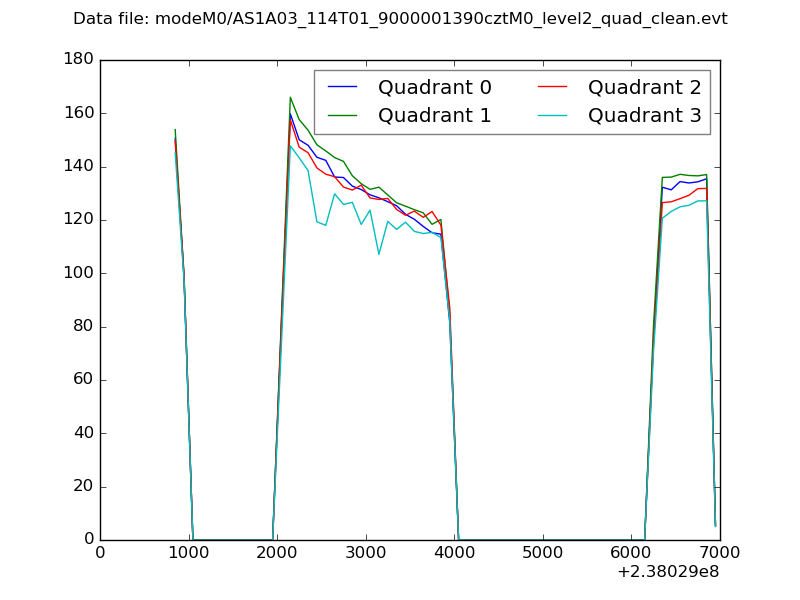 |
|
| Module-wise count rates for Quadrant A Data is divided into 100 sec bins |
 |
 |
| Module-wise count rates for Quadrant B Data is divided into 100 sec bins |
 |
 |
| Module-wise count rates for Quadrant C Data is divided into 100 sec bins |
 |
 |
| Module-wise count rates for Quadrant D Data is divided into 100 sec bins |
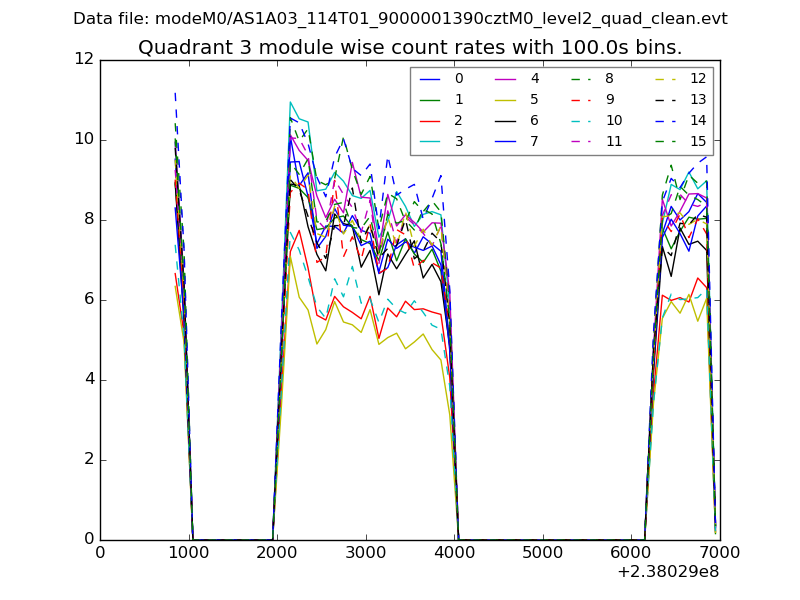 |
 |
| Parameter | Plot |
|---|---|
| CZT HV Monitor |  |
| D_VDD | 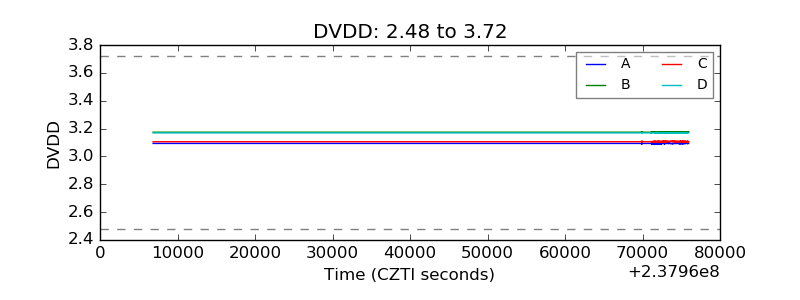 |
| Temperature 1 |  |
| Veto HV Monitor |  |
| Veto LLD | 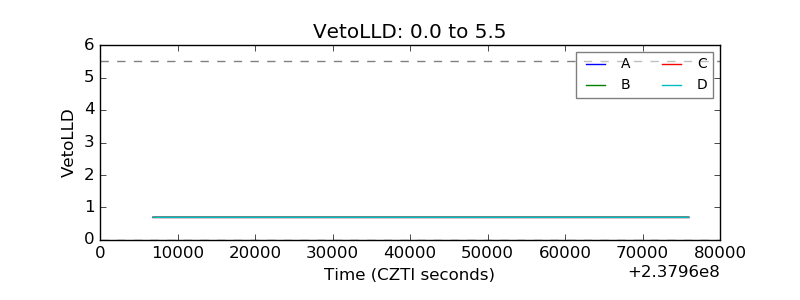 |
| Alpha Counter | 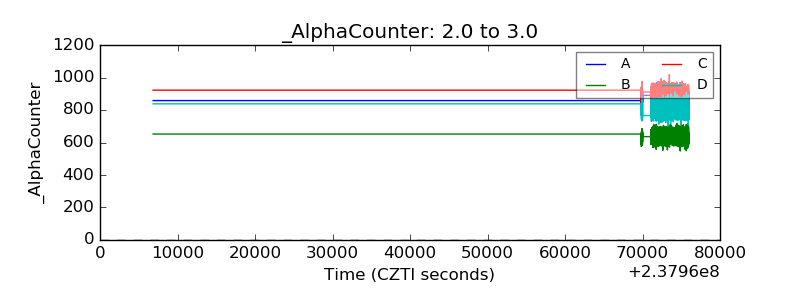 |
| _CPM_Rate | 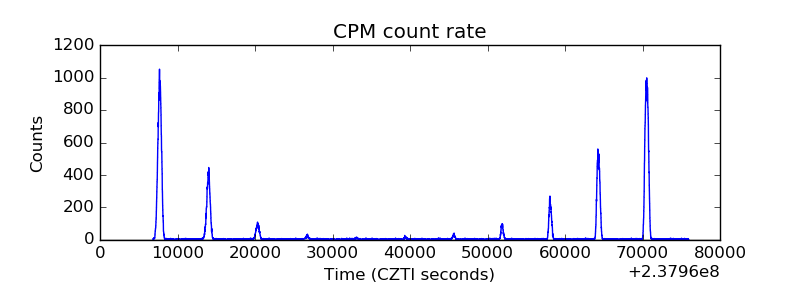 |
| CZT Counter |  |
| +2.5 Volts monitor |  |
| +5 Volts monitor |  |
| _ROLL_ROT |  |
| _Roll_DEC |  |
| _Roll_RA |  |
| Veto Counter |  |