| Param | Original file | Final file |
|---|---|---|
| Filename | modeM0/AS1A02_029T01_9000001386cztM0_level2.evt | modeM0/AS1A02_029T01_9000001386cztM0_level2_quad_clean.evt |
| Size (bytes) | 3,083,688,000 | 524,741,760 |
| Size | 2.9 GB | 500.4 MB |
| Events in quadrant A | 23,892,060 | 3,234,302 |
| Events in quadrant B | 22,394,256 | 3,301,595 |
| Events in quadrant C | 20,253,338 | 3,281,768 |
| Events in quadrant D | 23,943,203 | 3,118,825 |
| Mode M0 | |||
|---|---|---|---|
| Quadrant | BADHDUFLAG | Total packets | Discarded packets |
| A | 0 | 99664 | 0 |
| B | 0 | 93498 | 0 |
| C | 0 | 88692 | 0 |
| D | 0 | 100012 | 0 |
| Mode SS | |||
|---|---|---|---|
| Quadrant | BADHDUFLAG | Total packets | Discarded packets |
| A | 0 | 880 | 0 |
| B | 0 | 876 | 0 |
| C | 0 | 878 | 0 |
| D | 0 | 876 | 0 |
| Mode M9 | |||
|---|---|---|---|
| Quadrant | BADHDUFLAG | Total packets | Discarded packets |
| A | 0 | 83 | 0 |
| B | 0 | 83 | 0 |
| C | 0 | 83 | 0 |
| D | 0 | 82 | 0 |
| Quadrant | Total seconds | Saturated seconds | Saturation percentage |
|---|---|---|---|
| A | 43047 | 754 | 1.751574% |
| B | 43074 | 953 | 2.212472% |
| C | 43111 | 546 | 1.266498% |
| D | 43091 | 1267 | 2.940289% |
Noise dominated data is calculated using 1-second bins in cleaned event files. If a bin has >2000 counts, and if more than 50% of those come from <1% of pixels, then it is considered to be noise-dominated and hence unusable.
| Quadrant | # 1 sec bins | Bins with >0 counts | Bins with >2000 counts | High rate bins dominated by noise | Noise dominated (total time) | Noise dominated (detector-on time) | Marked lightcurve |
|---|---|---|---|---|---|---|---|
| A | 51484 | 43321 | 26 | 26 | 0.05% | 0.06% | 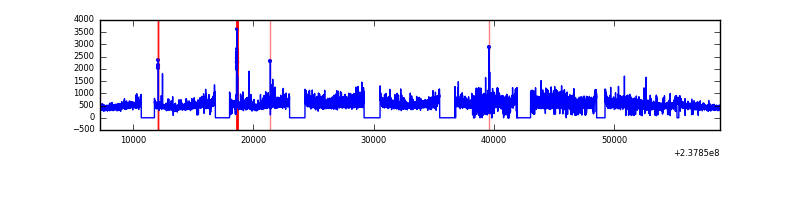 |
| B | 51484 | 43317 | 168 | 168 | 0.33% | 0.39% |  |
| C | 51484 | 43325 | 10 | 10 | 0.02% | 0.02% |  |
| D | 51484 | 43331 | 697 | 697 | 1.35% | 1.61% |  |
Top three noisy pixels from each quadrant. If the there are fewer than three noisy pixels in the level2.evt file, extra rows are filled as -1
| Pixel properties | Quadrant properties | ||||||
|---|---|---|---|---|---|---|---|
| Quadrant | DetID | PixID | Counts | Sigma | Mean | Median | Sigma |
| A | 1 | 162 | 1560838 | 1454.67 | 5280 | 5170 | 1069.4 |
| A | 1 | 178 | 704987 | 654.38 | 5280 | 5170 | 1069.4 |
| A | 1 | 161 | 651331 | 604.21 | 5280 | 5170 | 1069.4 |
| B | 10 | 245 | 505859 | 497.5 | 5323 | 5206 | 1006.3 |
| B | 4 | 173 | 489800 | 481.54 | 5323 | 5206 | 1006.3 |
| B | 0 | 219 | 268974 | 262.11 | 5323 | 5206 | 1006.3 |
| C | 14 | 234 | 84262 | 66.65 | 5171 | 5190 | 1186.4 |
| C | 13 | 61 | 38726 | 28.27 | 5171 | 5190 | 1186.4 |
| C | 8 | 222 | 15005 | 8.27 | 5171 | 5190 | 1186.4 |
| D | 1 | 52 | 2841790 | 2328.12 | 5089 | 4978 | 1218.5 |
| D | 2 | 152 | 594935 | 484.17 | 5089 | 4978 | 1218.5 |
| D | 12 | 233 | 576689 | 469.19 | 5089 | 4978 | 1218.5 |
Histogram calculated using DETX and DETY for each event in the final _common_clean file
| Quadrant A |  |
 |
Quadrant B |
|---|---|---|---|
| Quadrant D |  |
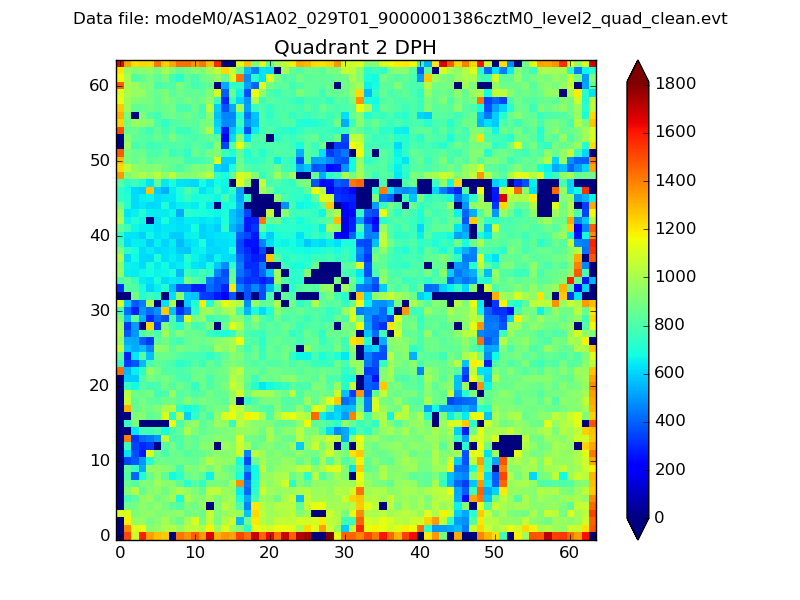 |
Quadrant C |
| Plot type | Count rate plots | Images |
|---|---|---|
| Comparison with Poisson distribution Blue bars denote a histogram of data divided into 1 sec bins. Red curve is a Poisson curve with rate = median count rate of data. |
 |
 |
| Quadrant-wise count rates Data is divided into 100 sec bins |
 |
|
| Module-wise count rates for Quadrant A Data is divided into 100 sec bins |
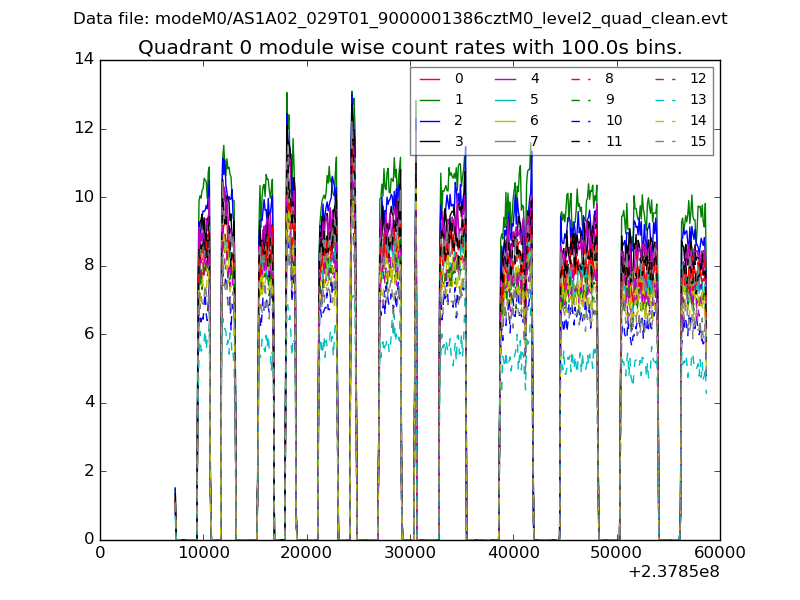 |
 |
| Module-wise count rates for Quadrant B Data is divided into 100 sec bins |
 |
 |
| Module-wise count rates for Quadrant C Data is divided into 100 sec bins |
 |
 |
| Module-wise count rates for Quadrant D Data is divided into 100 sec bins |
 |
 |
| Parameter | Plot |
|---|---|
| CZT HV Monitor |  |
| D_VDD |  |
| Temperature 1 |  |
| Veto HV Monitor |  |
| Veto LLD |  |
| Alpha Counter |  |
| _CPM_Rate |  |
| CZT Counter |  |
| +2.5 Volts monitor |  |
| +5 Volts monitor |  |
| _ROLL_ROT |  |
| _Roll_DEC |  |
| _Roll_RA |  |
| Veto Counter |  |