| Param | Original file | Final file |
|---|---|---|
| Filename | modeM0/AS1A03_084T01_9000001382cztM0_level2.evt | modeM0/AS1A03_084T01_9000001382cztM0_level2_quad_clean.evt |
| Size (bytes) | 1,382,797,440 | 253,575,360 |
| Size | 1.3 GB | 241.8 MB |
| Events in quadrant A | 10,008,875 | 1,599,332 |
| Events in quadrant B | 9,709,771 | 1,623,788 |
| Events in quadrant C | 10,274,389 | 1,567,162 |
| Events in quadrant D | 10,559,909 | 1,539,988 |
| Mode M0 | |||
|---|---|---|---|
| Quadrant | BADHDUFLAG | Total packets | Discarded packets |
| A | 0 | 41771 | 0 |
| B | 0 | 41326 | 0 |
| C | 0 | 44109 | 0 |
| D | 0 | 44308 | 0 |
| Mode M9 | |||
|---|---|---|---|
| Quadrant | BADHDUFLAG | Total packets | Discarded packets |
| A | 0 | 22 | 0 |
| B | 0 | 22 | 0 |
| C | 0 | 22 | 0 |
| D | 0 | 22 | 0 |
| Mode SS | |||
|---|---|---|---|
| Quadrant | BADHDUFLAG | Total packets | Discarded packets |
| A | 0 | 400 | 0 |
| B | 0 | 400 | 0 |
| C | 0 | 400 | 0 |
| D | 0 | 400 | 0 |
| Quadrant | Total seconds | Saturated seconds | Saturation percentage |
|---|---|---|---|
| A | 19601 | 485 | 2.474364% |
| B | 19601 | 470 | 2.397837% |
| C | 19601 | 684 | 3.489618% |
| D | 19600 | 466 | 2.377551% |
Noise dominated data is calculated using 1-second bins in cleaned event files. If a bin has >2000 counts, and if more than 50% of those come from <1% of pixels, then it is considered to be noise-dominated and hence unusable.
| Quadrant | # 1 sec bins | Bins with >0 counts | Bins with >2000 counts | High rate bins dominated by noise | Noise dominated (total time) | Noise dominated (detector-on time) | Marked lightcurve |
|---|---|---|---|---|---|---|---|
| A | 21041 | 19607 | 11 | 11 | 0.05% | 0.06% |  |
| B | 21041 | 19607 | 5 | 5 | 0.02% | 0.03% | 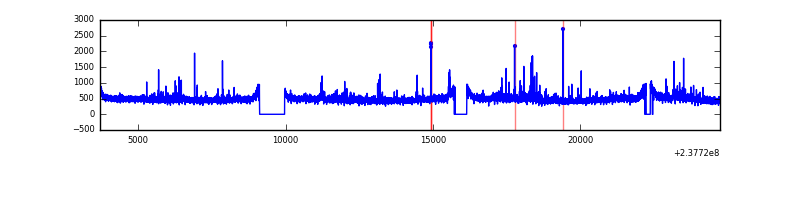 |
| C | 21041 | 19607 | 295 | 295 | 1.40% | 1.50% |  |
| D | 21041 | 19607 | 88 | 88 | 0.42% | 0.45% |  |
Top three noisy pixels from each quadrant. If the there are fewer than three noisy pixels in the level2.evt file, extra rows are filled as -1
| Pixel properties | Quadrant properties | ||||||
|---|---|---|---|---|---|---|---|
| Quadrant | DetID | PixID | Counts | Sigma | Mean | Median | Sigma |
| A | 1 | 162 | 374279 | 768.09 | 2370 | 2318 | 484.3 |
| A | 1 | 178 | 139142 | 282.54 | 2370 | 2318 | 484.3 |
| A | 1 | 161 | 124948 | 253.23 | 2370 | 2318 | 484.3 |
| B | 0 | 214 | 126310 | 274.18 | 2373 | 2313 | 452.3 |
| B | 0 | 229 | 73401 | 157.19 | 2373 | 2313 | 452.3 |
| B | 0 | 187 | 69436 | 148.42 | 2373 | 2313 | 452.3 |
| C | 14 | 234 | 1282127 | 2407.35 | 2275 | 2280 | 531.6 |
| C | 10 | 22 | 70181 | 127.72 | 2275 | 2280 | 531.6 |
| C | 9 | 237 | 39600 | 70.2 | 2275 | 2280 | 531.6 |
| D | 1 | 52 | 1033490 | 1854.15 | 2282 | 2228 | 556.2 |
| D | 12 | 233 | 256239 | 456.7 | 2282 | 2228 | 556.2 |
| D | 8 | 195 | 207856 | 369.71 | 2282 | 2228 | 556.2 |
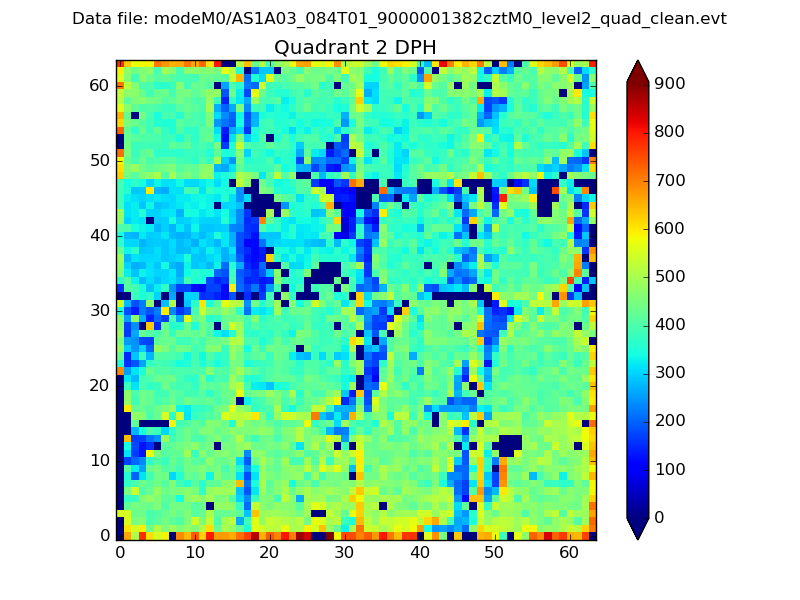
Histogram calculated using DETX and DETY for each event in the final _common_clean file
| Quadrant A |  |
 |
Quadrant B |
|---|---|---|---|
| Quadrant D |  |
 |
Quadrant C |
| Plot type | Count rate plots | Images |
|---|---|---|
| Comparison with Poisson distribution Blue bars denote a histogram of data divided into 1 sec bins. Red curve is a Poisson curve with rate = median count rate of data. |
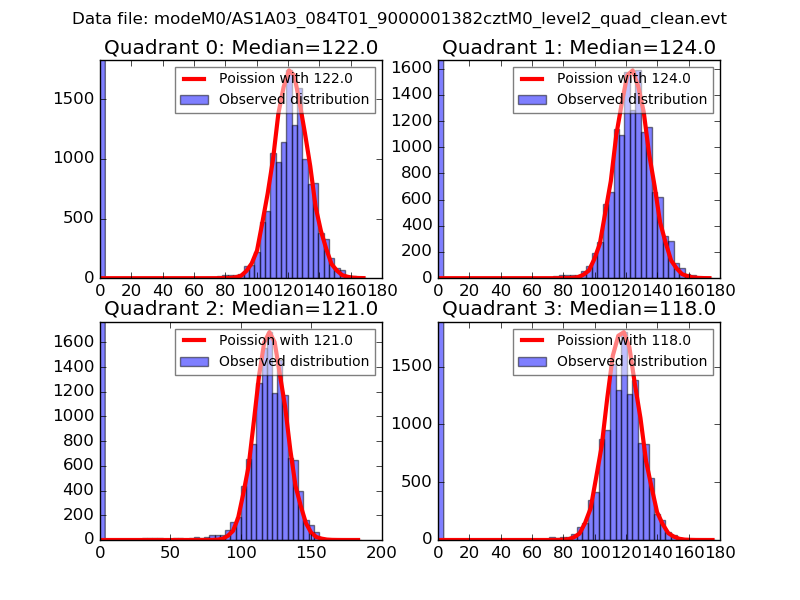 |
 |
| Quadrant-wise count rates Data is divided into 100 sec bins |
 |
|
| Module-wise count rates for Quadrant A Data is divided into 100 sec bins |
 |
 |
| Module-wise count rates for Quadrant B Data is divided into 100 sec bins |
 |
 |
| Module-wise count rates for Quadrant C Data is divided into 100 sec bins |
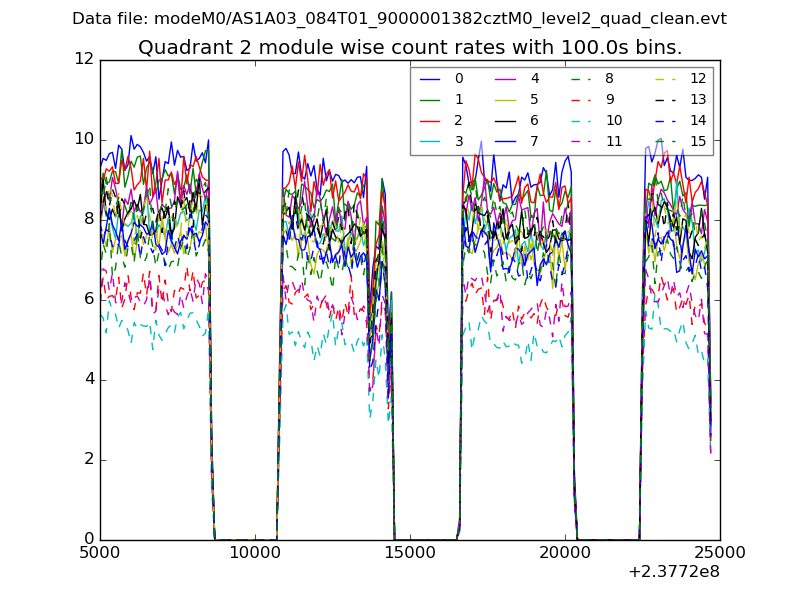 |
 |
| Module-wise count rates for Quadrant D Data is divided into 100 sec bins |
 |
 |
| Parameter | Plot |
|---|---|
| CZT HV Monitor |  |
| D_VDD |  |
| Temperature 1 | 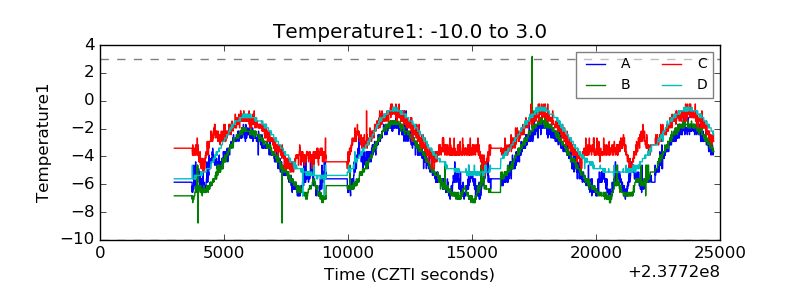 |
| Veto HV Monitor | 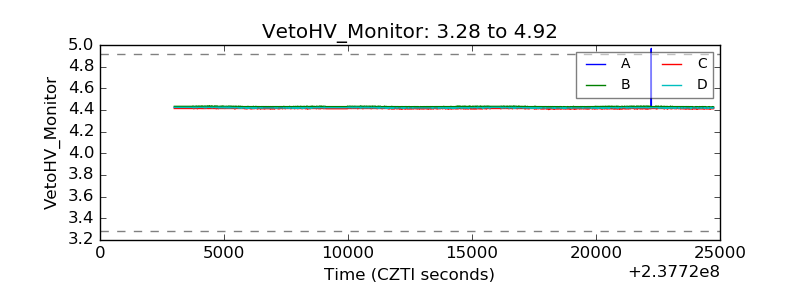 |
| Veto LLD |  |
| Alpha Counter |  |
| _CPM_Rate | 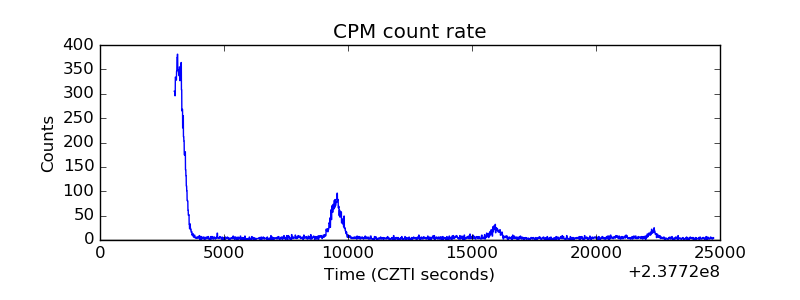 |
| CZT Counter |  |
| +2.5 Volts monitor |  |
| +5 Volts monitor |  |
| _ROLL_ROT |  |
| _Roll_DEC |  |
| _Roll_RA |  |
| Veto Counter |  |