| Param | Original file | Final file |
|---|---|---|
| Filename | modeM0/AS1A03_029T01_9000001384cztM0_level2.evt | modeM0/AS1A03_029T01_9000001384cztM0_level2_quad_clean.evt |
| Size (bytes) | 6,599,085,120 | 1,175,955,840 |
| Size | 6.1 GB | 1.1 GB |
| Events in quadrant A | 45,890,728 | 7,292,140 |
| Events in quadrant B | 46,518,096 | 7,427,326 |
| Events in quadrant C | 45,069,862 | 7,317,173 |
| Events in quadrant D | 55,896,980 | 7,000,805 |
| Mode M9 | |||
|---|---|---|---|
| Quadrant | BADHDUFLAG | Total packets | Discarded packets |
| A | 0 | 146 | 0 |
| B | 0 | 146 | 0 |
| C | 0 | 145 | 0 |
| D | 0 | 145 | 0 |
| Mode M0 | |||
|---|---|---|---|
| Quadrant | BADHDUFLAG | Total packets | Discarded packets |
| A | 0 | 199778 | 0 |
| B | 0 | 200156 | 0 |
| C | 0 | 199277 | 0 |
| D | 0 | 231790 | 0 |
| Mode SS | |||
|---|---|---|---|
| Quadrant | BADHDUFLAG | Total packets | Discarded packets |
| A | 0 | 1962 | 0 |
| B | 0 | 1954 | 0 |
| C | 0 | 1968 | 0 |
| D | 0 | 1960 | 0 |
| Quadrant | Total seconds | Saturated seconds | Saturation percentage |
|---|---|---|---|
| A | 96031 | 1479 | 1.540128% |
| B | 96003 | 1049 | 1.092674% |
| C | 96021 | 728 | 0.758167% |
| D | 95950 | 1838 | 1.915581% |
Noise dominated data is calculated using 1-second bins in cleaned event files. If a bin has >2000 counts, and if more than 50% of those come from <1% of pixels, then it is considered to be noise-dominated and hence unusable.
| Quadrant | # 1 sec bins | Bins with >0 counts | Bins with >2000 counts | High rate bins dominated by noise | Noise dominated (total time) | Noise dominated (detector-on time) | Marked lightcurve |
|---|---|---|---|---|---|---|---|
| A | 111684 | 96409 | 56 | 56 | 0.05% | 0.06% | 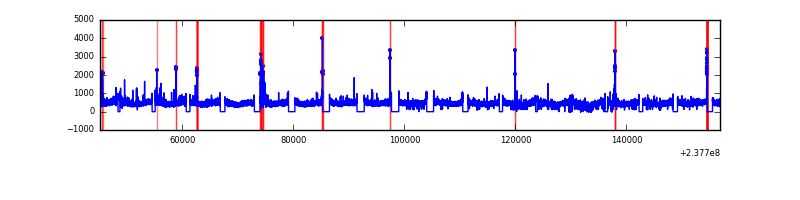 |
| B | 111684 | 96427 | 26 | 26 | 0.02% | 0.03% |  |
| C | 111684 | 96422 | 91 | 91 | 0.08% | 0.09% |  |
| D | 111684 | 96387 | 963 | 963 | 0.86% | 1.00% |  |
Top three noisy pixels from each quadrant. If the there are fewer than three noisy pixels in the level2.evt file, extra rows are filled as -1
| Pixel properties | Quadrant properties | ||||||
|---|---|---|---|---|---|---|---|
| Quadrant | DetID | PixID | Counts | Sigma | Mean | Median | Sigma |
| A | 14 | 111 | 677959 | 290.9 | 11459 | 11234 | 2291.9 |
| A | 1 | 162 | 379888 | 160.85 | 11459 | 11234 | 2291.9 |
| A | 15 | 174 | 303710 | 127.61 | 11459 | 11234 | 2291.9 |
| B | 0 | 214 | 613194 | 276.04 | 11579 | 11317 | 2180.4 |
| B | 12 | 111 | 241602 | 105.62 | 11579 | 11317 | 2180.4 |
| B | 0 | 219 | 235486 | 102.81 | 11579 | 11317 | 2180.4 |
| C | 9 | 68 | 736894 | 281.8 | 11190 | 11246 | 2575.0 |
| C | 14 | 234 | 521653 | 198.21 | 11190 | 11246 | 2575.0 |
| C | 13 | 61 | 83948 | 28.23 | 11190 | 11246 | 2575.0 |
| D | 1 | 52 | 11051242 | 4124.22 | 11030 | 10779 | 2677.0 |
| D | 12 | 233 | 831972 | 306.76 | 11030 | 10779 | 2677.0 |
| D | 7 | 71 | 525819 | 192.4 | 11030 | 10779 | 2677.0 |
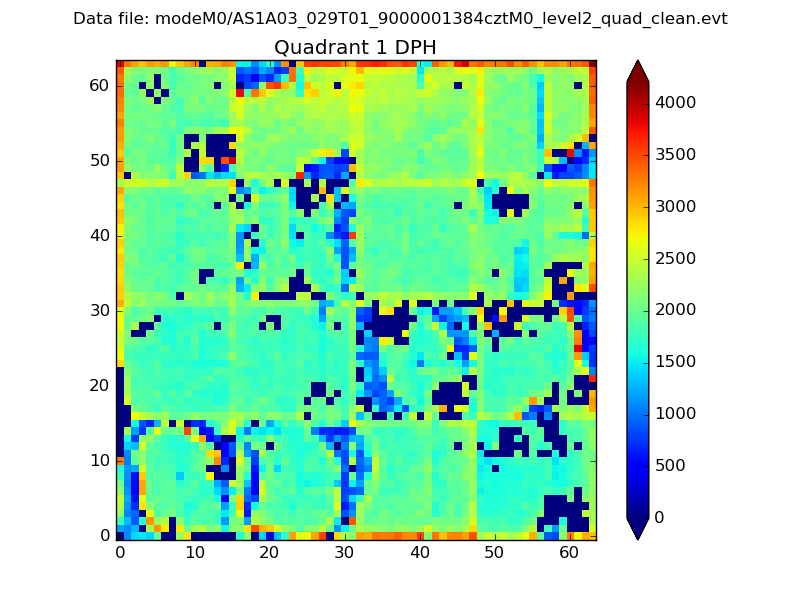
Histogram calculated using DETX and DETY for each event in the final _common_clean file
| Quadrant A |  |
 |
Quadrant B |
|---|---|---|---|
| Quadrant D |  |
 |
Quadrant C |
| Plot type | Count rate plots | Images |
|---|---|---|
| Comparison with Poisson distribution Blue bars denote a histogram of data divided into 1 sec bins. Red curve is a Poisson curve with rate = median count rate of data. |
 |
 |
| Quadrant-wise count rates Data is divided into 100 sec bins |
 |
|
| Module-wise count rates for Quadrant A Data is divided into 100 sec bins |
 |
 |
| Module-wise count rates for Quadrant B Data is divided into 100 sec bins |
 |
 |
| Module-wise count rates for Quadrant C Data is divided into 100 sec bins |
 |
 |
| Module-wise count rates for Quadrant D Data is divided into 100 sec bins |
 |
 |
| Parameter | Plot |
|---|---|
| CZT HV Monitor |  |
| D_VDD |  |
| Temperature 1 | 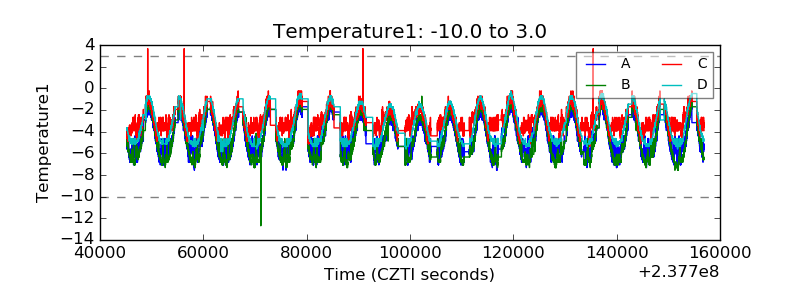 |
| Veto HV Monitor |  |
| Veto LLD |  |
| Alpha Counter |  |
| _CPM_Rate |  |
| CZT Counter |  |
| +2.5 Volts monitor |  |
| +5 Volts monitor | 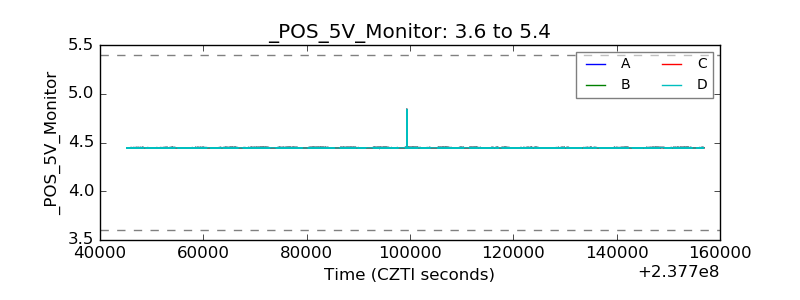 |
| _ROLL_ROT |  |
| _Roll_DEC |  |
| _Roll_RA |  |
| Veto Counter |  |