| Param | Original file | Final file |
|---|---|---|
| Filename | modeM0/AS1A03_068T01_9000001380cztM0_level2.evt | modeM0/AS1A03_068T01_9000001380cztM0_level2_quad_clean.evt |
| Size (bytes) | 3,050,308,800 | 512,640,000 |
| Size | 2.8 GB | 488.9 MB |
| Events in quadrant A | 21,268,589 | 3,168,135 |
| Events in quadrant B | 21,190,082 | 3,232,216 |
| Events in quadrant C | 22,153,156 | 3,088,329 |
| Events in quadrant D | 24,766,392 | 2,988,031 |
| Mode M0 | |||
|---|---|---|---|
| Quadrant | BADHDUFLAG | Total packets | Discarded packets |
| A | 0 | 91883 | 0 |
| B | 0 | 91489 | 0 |
| C | 0 | 95974 | 0 |
| D | 0 | 102737 | 0 |
| Mode M9 | |||
|---|---|---|---|
| Quadrant | BADHDUFLAG | Total packets | Discarded packets |
| A | 0 | 75 | 0 |
| B | 0 | 77 | 0 |
| C | 0 | 80 | 0 |
| D | 0 | 78 | 0 |
| Mode SS | |||
|---|---|---|---|
| Quadrant | BADHDUFLAG | Total packets | Discarded packets |
| A | 0 | 932 | 0 |
| B | 0 | 934 | 0 |
| C | 0 | 932 | 0 |
| D | 0 | 912 | 0 |
| Quadrant | Total seconds | Saturated seconds | Saturation percentage |
|---|---|---|---|
| A | 44456 | 449 | 1.009987% |
| B | 44432 | 559 | 1.258102% |
| C | 44479 | 806 | 1.812091% |
| D | 44037 | 1034 | 2.348026% |
Noise dominated data is calculated using 1-second bins in cleaned event files. If a bin has >2000 counts, and if more than 50% of those come from <1% of pixels, then it is considered to be noise-dominated and hence unusable.
| Quadrant | # 1 sec bins | Bins with >0 counts | Bins with >2000 counts | High rate bins dominated by noise | Noise dominated (total time) | Noise dominated (detector-on time) | Marked lightcurve |
|---|---|---|---|---|---|---|---|
| A | 56896 | 45105 | 0 | 0 | 0.00% | 0.00% | 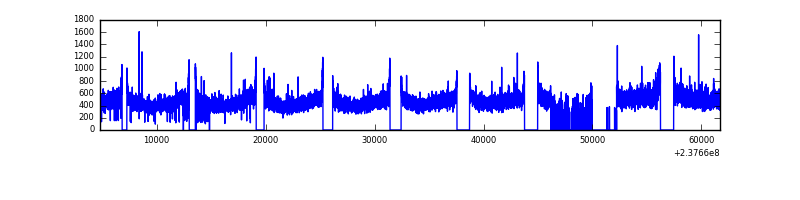 |
| B | 56896 | 45080 | 5 | 5 | 0.01% | 0.01% |  |
| C | 56896 | 45123 | 323 | 323 | 0.57% | 0.72% | 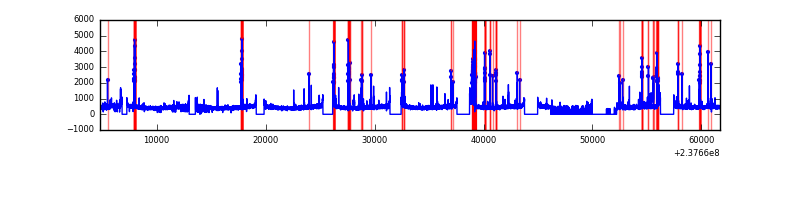 |
| D | 56896 | 44550 | 639 | 639 | 1.12% | 1.43% |  |
Top three noisy pixels from each quadrant. If the there are fewer than three noisy pixels in the level2.evt file, extra rows are filled as -1
| Pixel properties | Quadrant properties | ||||||
|---|---|---|---|---|---|---|---|
| Quadrant | DetID | PixID | Counts | Sigma | Mean | Median | Sigma |
| A | 1 | 162 | 185861 | 164.92 | 5438 | 5331 | 1094.7 |
| A | 1 | 178 | 70723 | 59.74 | 5438 | 5331 | 1094.7 |
| A | 1 | 161 | 60698 | 50.58 | 5438 | 5331 | 1094.7 |
| B | 12 | 111 | 122795 | 113.85 | 5434 | 5306 | 1031.9 |
| B | 11 | 111 | 100335 | 92.09 | 5434 | 5306 | 1031.9 |
| B | 14 | 111 | 80313 | 72.69 | 5434 | 5306 | 1031.9 |
| C | 14 | 234 | 1604357 | 1323.71 | 5236 | 5265 | 1208.0 |
| C | 9 | 68 | 111500 | 87.94 | 5236 | 5265 | 1208.0 |
| C | 13 | 61 | 38835 | 27.79 | 5236 | 5265 | 1208.0 |
| D | 1 | 52 | 2885697 | 2227.77 | 5138 | 5024 | 1293.1 |
| D | 8 | 195 | 1528711 | 1178.34 | 5138 | 5024 | 1293.1 |
| D | 12 | 233 | 422937 | 323.19 | 5138 | 5024 | 1293.1 |
Histogram calculated using DETX and DETY for each event in the final _common_clean file
| Quadrant A |  |
 |
Quadrant B |
|---|---|---|---|
| Quadrant D |  |
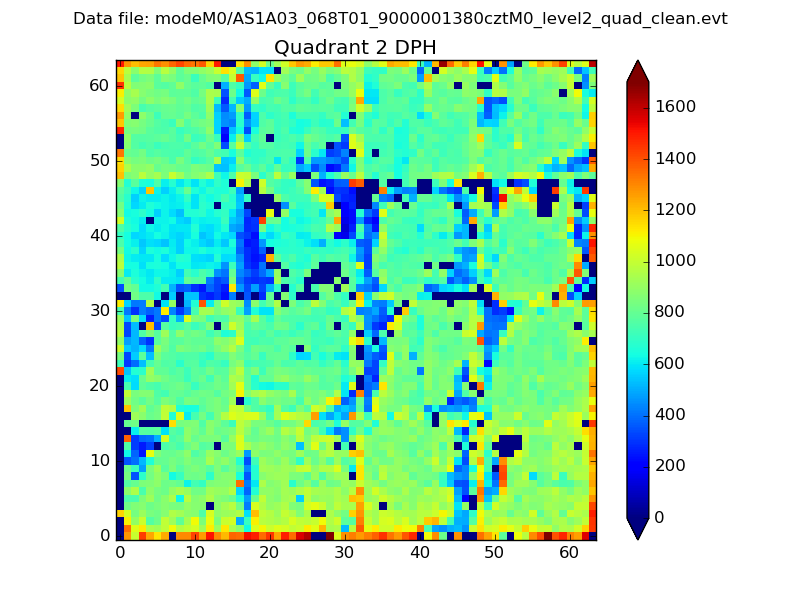 |
Quadrant C |
| Plot type | Count rate plots | Images |
|---|---|---|
| Comparison with Poisson distribution Blue bars denote a histogram of data divided into 1 sec bins. Red curve is a Poisson curve with rate = median count rate of data. |
 |
 |
| Quadrant-wise count rates Data is divided into 100 sec bins |
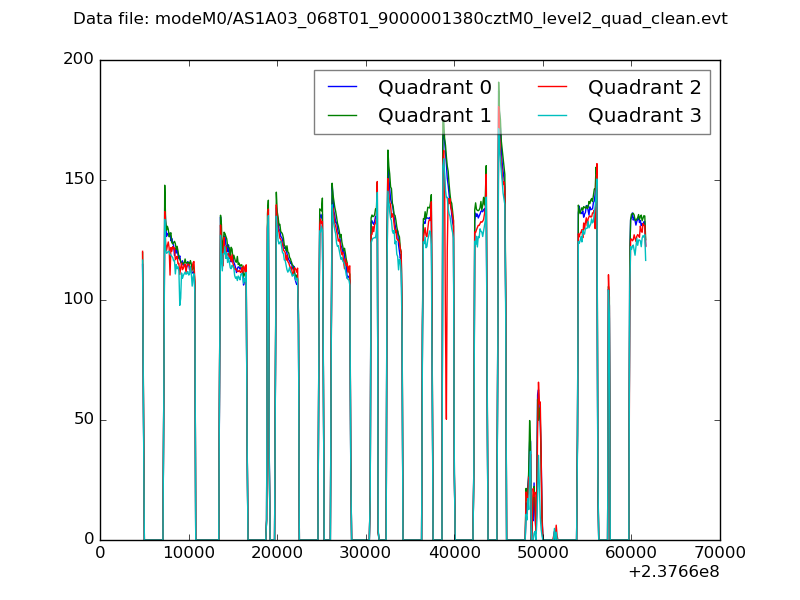 |
|
| Module-wise count rates for Quadrant A Data is divided into 100 sec bins |
 |
 |
| Module-wise count rates for Quadrant B Data is divided into 100 sec bins |
 |
 |
| Module-wise count rates for Quadrant C Data is divided into 100 sec bins |
 |
 |
| Module-wise count rates for Quadrant D Data is divided into 100 sec bins |
 |
 |
| Parameter | Plot |
|---|---|
| CZT HV Monitor |  |
| D_VDD |  |
| Temperature 1 | 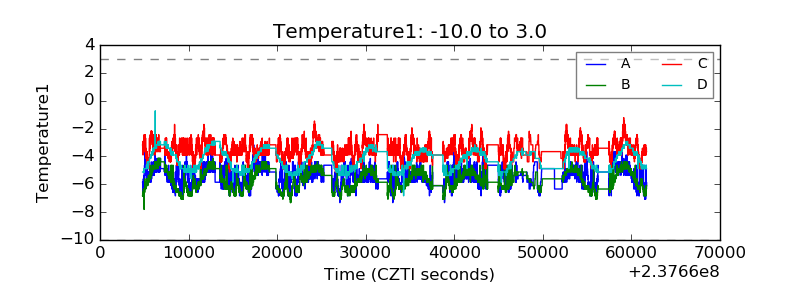 |
| Veto HV Monitor |  |
| Veto LLD |  |
| Alpha Counter |  |
| _CPM_Rate |  |
| CZT Counter |  |
| +2.5 Volts monitor |  |
| +5 Volts monitor | 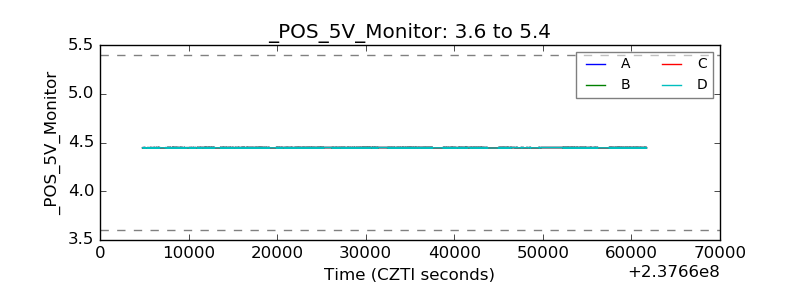 |
| _ROLL_ROT |  |
| _Roll_DEC |  |
| _Roll_RA |  |
| Veto Counter | 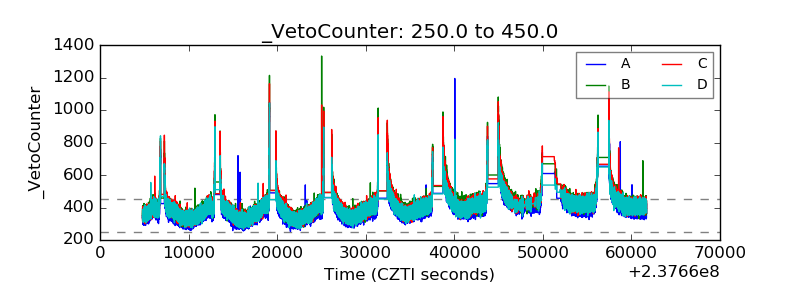 |