| Param | Original file | Final file |
|---|---|---|
| Filename | modeM0/AS1A02_198T01_9000001376cztM0_level2.evt | modeM0/AS1A02_198T01_9000001376cztM0_level2_quad_clean.evt |
| Size (bytes) | 5,199,082,560 | 982,238,400 |
| Size | 4.8 GB | 936.7 MB |
| Events in quadrant A | 37,156,796 | 6,215,918 |
| Events in quadrant B | 36,593,243 | 6,235,562 |
| Events in quadrant C | 33,933,658 | 6,227,236 |
| Events in quadrant D | 44,756,195 | 5,976,501 |
| Mode SS | |||
|---|---|---|---|
| Quadrant | BADHDUFLAG | Total packets | Discarded packets |
| A | 0 | 1512 | 0 |
| B | 0 | 1520 | 0 |
| C | 0 | 1512 | 0 |
| D | 0 | 1512 | 0 |
| Mode M0 | |||
|---|---|---|---|
| Quadrant | BADHDUFLAG | Total packets | Discarded packets |
| A | 0 | 158047 | 0 |
| B | 0 | 156969 | 0 |
| C | 0 | 152573 | 0 |
| D | 0 | 183813 | 0 |
| Mode M9 | |||
|---|---|---|---|
| Quadrant | BADHDUFLAG | Total packets | Discarded packets |
| A | 0 | 121 | 0 |
| B | 0 | 120 | 0 |
| C | 0 | 120 | 0 |
| D | 0 | 121 | 0 |
| Quadrant | Total seconds | Saturated seconds | Saturation percentage |
|---|---|---|---|
| A | 74347 | 981 | 1.319488% |
| B | 74331 | 913 | 1.228290% |
| C | 74313 | 557 | 0.749532% |
| D | 74292 | 2497 | 3.361062% |
Noise dominated data is calculated using 1-second bins in cleaned event files. If a bin has >2000 counts, and if more than 50% of those come from <1% of pixels, then it is considered to be noise-dominated and hence unusable.
| Quadrant | # 1 sec bins | Bins with >0 counts | Bins with >2000 counts | High rate bins dominated by noise | Noise dominated (total time) | Noise dominated (detector-on time) | Marked lightcurve |
|---|---|---|---|---|---|---|---|
| A | 86973 | 74784 | 160 | 160 | 0.18% | 0.21% |  |
| B | 86973 | 74790 | 44 | 44 | 0.05% | 0.06% |  |
| C | 86973 | 74777 | 25 | 25 | 0.03% | 0.03% | 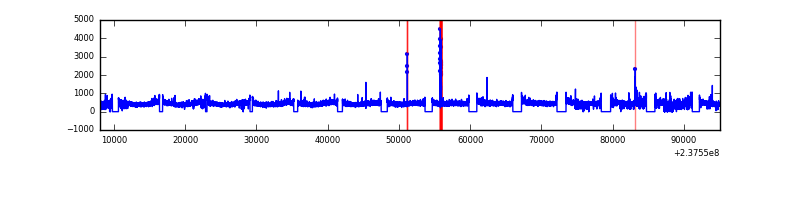 |
| D | 86973 | 74774 | 1990 | 1990 | 2.29% | 2.66% |  |
Top three noisy pixels from each quadrant. If the there are fewer than three noisy pixels in the level2.evt file, extra rows are filled as -1
| Pixel properties | Quadrant properties | ||||||
|---|---|---|---|---|---|---|---|
| Quadrant | DetID | PixID | Counts | Sigma | Mean | Median | Sigma |
| A | 8 | 15 | 1237371 | 695.04 | 8844 | 8670 | 1767.8 |
| A | 1 | 162 | 603415 | 336.43 | 8844 | 8670 | 1767.8 |
| A | 15 | 174 | 585039 | 326.03 | 8844 | 8670 | 1767.8 |
| B | 0 | 214 | 700244 | 421.33 | 8862 | 8673 | 1641.4 |
| B | 0 | 219 | 319350 | 189.27 | 8862 | 8673 | 1641.4 |
| B | 4 | 173 | 238306 | 139.9 | 8862 | 8673 | 1641.4 |
| C | 9 | 68 | 202128 | 98.42 | 8602 | 8627 | 1966.0 |
| C | 14 | 234 | 127948 | 60.69 | 8602 | 8627 | 1966.0 |
| C | 13 | 61 | 64469 | 28.4 | 8602 | 8627 | 1966.0 |
| D | 1 | 52 | 6285498 | 3043.6 | 8510 | 8294 | 2062.4 |
| D | 8 | 195 | 2696395 | 1303.37 | 8510 | 8294 | 2062.4 |
| D | 12 | 233 | 1590816 | 767.31 | 8510 | 8294 | 2062.4 |
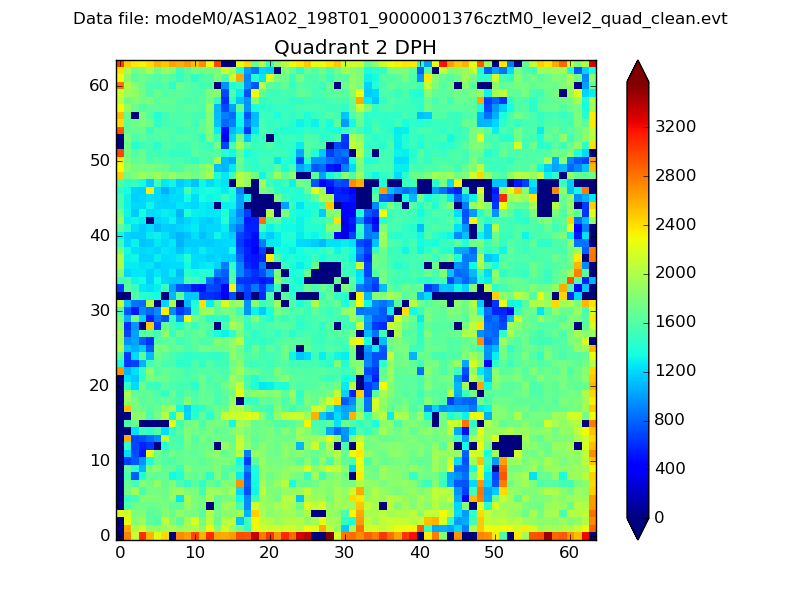
Histogram calculated using DETX and DETY for each event in the final _common_clean file
| Quadrant A |  |
 |
Quadrant B |
|---|---|---|---|
| Quadrant D | 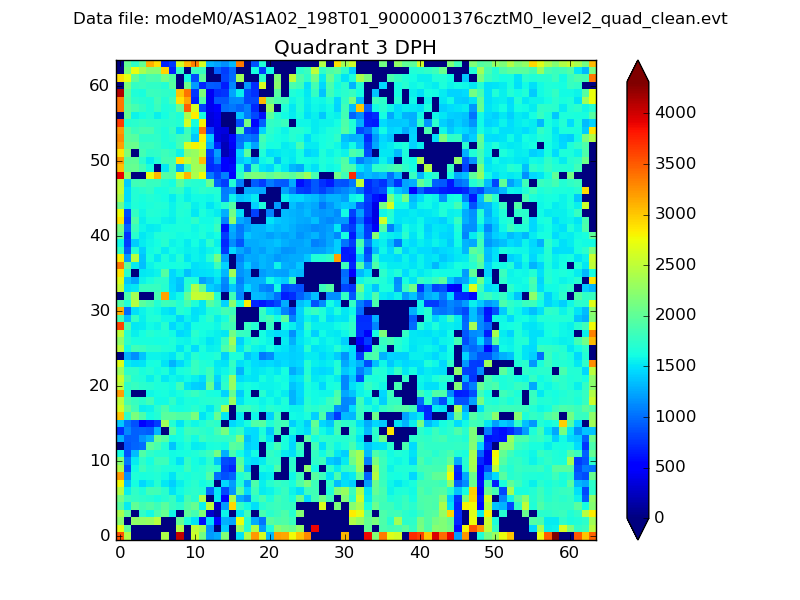 |
 |
Quadrant C |
| Plot type | Count rate plots | Images |
|---|---|---|
| Comparison with Poisson distribution Blue bars denote a histogram of data divided into 1 sec bins. Red curve is a Poisson curve with rate = median count rate of data. |
 |
 |
| Quadrant-wise count rates Data is divided into 100 sec bins |
 |
|
| Module-wise count rates for Quadrant A Data is divided into 100 sec bins |
 |
 |
| Module-wise count rates for Quadrant B Data is divided into 100 sec bins |
 |
 |
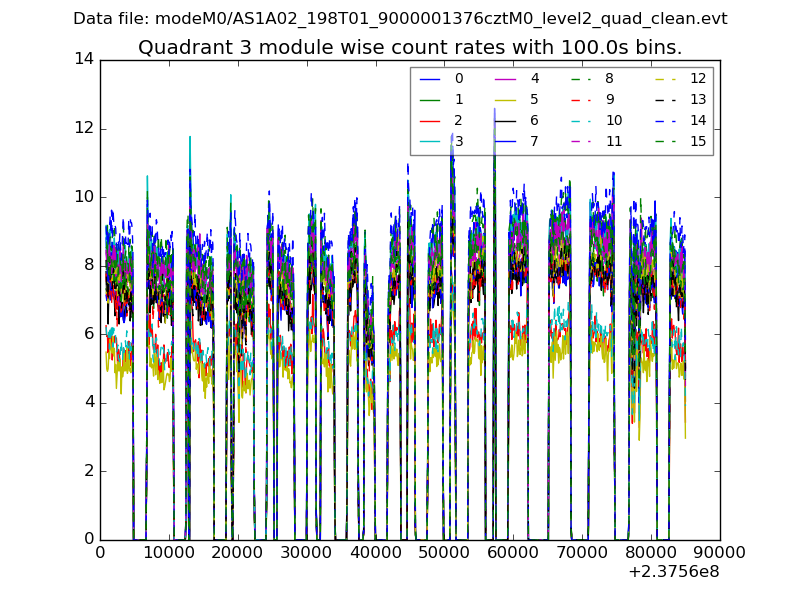
| Module-wise count rates for Quadrant C Data is divided into 100 sec bins |
 |
 |
| Module-wise count rates for Quadrant D Data is divided into 100 sec bins |
 |
 |
| Parameter | Plot |
|---|---|
| CZT HV Monitor |  |
| D_VDD |  |
| Temperature 1 |  |
| Veto HV Monitor |  |
| Veto LLD |  |
| Alpha Counter |  |
| _CPM_Rate |  |
| CZT Counter | 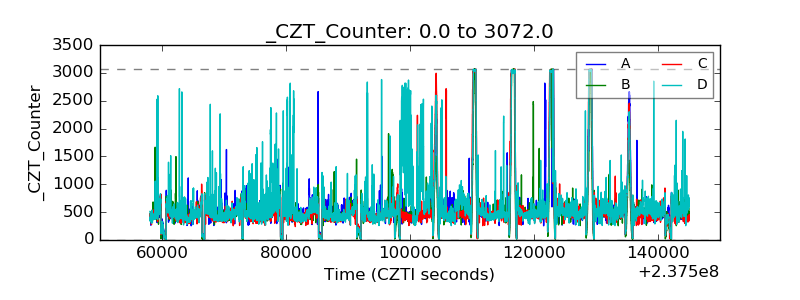 |
| +2.5 Volts monitor |  |
| +5 Volts monitor |  |
| _ROLL_ROT |  |
| _Roll_DEC | 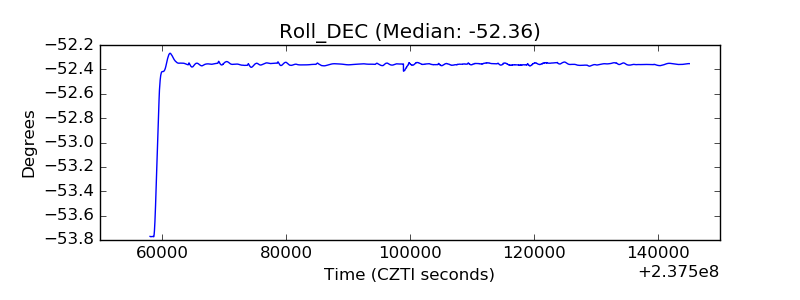 |
| _Roll_RA |  |
| Veto Counter |  |