| Param | Original file | Final file |
|---|---|---|
| Filename | modeM0/AS1G07_028T01_9000001370cztM0_level2.evt | modeM0/AS1G07_028T01_9000001370cztM0_level2_quad_clean.evt |
| Size (bytes) | 1,081,186,560 | 198,057,600 |
| Size | 1.0 GB | 188.9 MB |
| Events in quadrant A | 8,271,963 | 1,337,449 |
| Events in quadrant B | 8,345,444 | 1,344,201 |
| Events in quadrant C | 5,818,451 | 937,651 |
| Events in quadrant D | 9,221,482 | 1,274,475 |
| Mode M0 | |||
|---|---|---|---|
| Quadrant | BADHDUFLAG | Total packets | Discarded packets |
| A | 0 | 36240 | 0 |
| B | 0 | 36279 | 0 |
| C | 0 | 25541 | 0 |
| D | 0 | 39001 | 0 |
| Mode M9 | |||
|---|---|---|---|
| Quadrant | BADHDUFLAG | Total packets | Discarded packets |
| A | 0 | 13 | 0 |
| B | 0 | 11 | 0 |
| C | 0 | 13 | 0 |
| D | 0 | 12 | 0 |
| Mode SS | |||
|---|---|---|---|
| Quadrant | BADHDUFLAG | Total packets | Discarded packets |
| A | 0 | 354 | 0 |
| B | 0 | 360 | 0 |
| C | 0 | 344 | 0 |
| D | 0 | 352 | 0 |
| Quadrant | Total seconds | Saturated seconds | Saturation percentage |
|---|---|---|---|
| A | 17253 | 510 | 2.956008% |
| B | 17207 | 587 | 3.411402% |
| C | 12065 | 449 | 3.721508% |
| D | 17102 | 500 | 2.923635% |
Noise dominated data is calculated using 1-second bins in cleaned event files. If a bin has >2000 counts, and if more than 50% of those come from <1% of pixels, then it is considered to be noise-dominated and hence unusable.
| Quadrant | # 1 sec bins | Bins with >0 counts | Bins with >2000 counts | High rate bins dominated by noise | Noise dominated (total time) | Noise dominated (detector-on time) | Marked lightcurve |
|---|---|---|---|---|---|---|---|
| A | 21655 | 19240 | 1 | 1 | 0.00% | 0.01% | 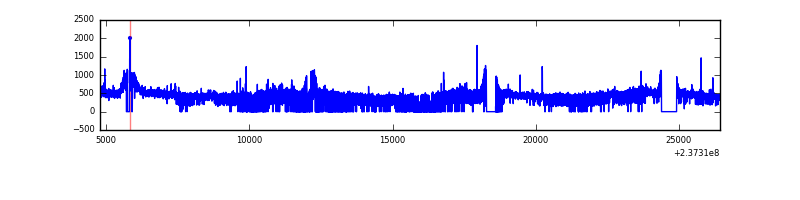 |
| B | 21655 | 19154 | 13 | 13 | 0.06% | 0.07% |  |
| C | 15493 | 13632 | 0 | 0 | 0.00% | 0.00% | 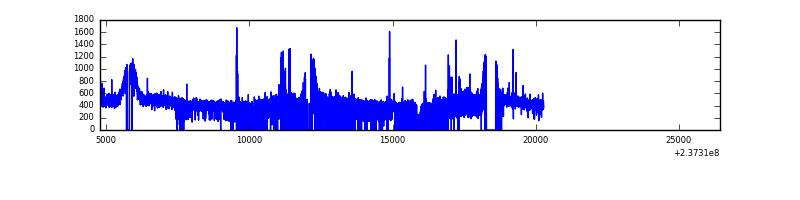 |
| D | 21655 | 19049 | 47 | 47 | 0.22% | 0.25% | 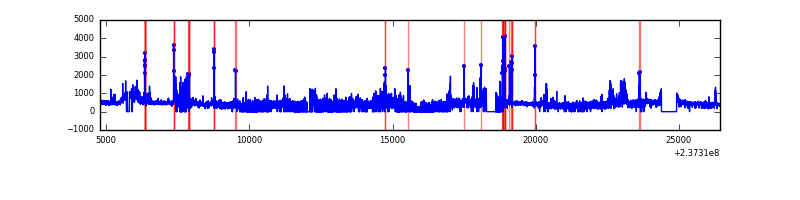 |
Top three noisy pixels from each quadrant. If the there are fewer than three noisy pixels in the level2.evt file, extra rows are filled as -1
| Pixel properties | Quadrant properties | ||||||
|---|---|---|---|---|---|---|---|
| Quadrant | DetID | PixID | Counts | Sigma | Mean | Median | Sigma |
| A | 1 | 162 | 45291 | 99.59 | 2123 | 2076 | 433.9 |
| A | 14 | 111 | 26313 | 55.85 | 2123 | 2076 | 433.9 |
| A | 0 | 226 | 19274 | 39.63 | 2123 | 2076 | 433.9 |
| B | 10 | 252 | 52946 | 124.66 | 2114 | 2059 | 408.2 |
| B | 12 | 111 | 48627 | 114.08 | 2114 | 2059 | 408.2 |
| B | 15 | 85 | 40788 | 94.87 | 2114 | 2059 | 408.2 |
| C | 4 | 254 | 44026 | 123.43 | 1470 | 1479 | 344.7 |
| C | 14 | 234 | 21510 | 58.11 | 1470 | 1479 | 344.7 |
| C | 8 | 128 | 11795 | 29.93 | 1470 | 1479 | 344.7 |
| D | 1 | 52 | 415579 | 831.04 | 2043 | 1995 | 497.7 |
| D | 7 | 46 | 389555 | 778.74 | 2043 | 1995 | 497.7 |
| D | 10 | 199 | 339286 | 677.74 | 2043 | 1995 | 497.7 |
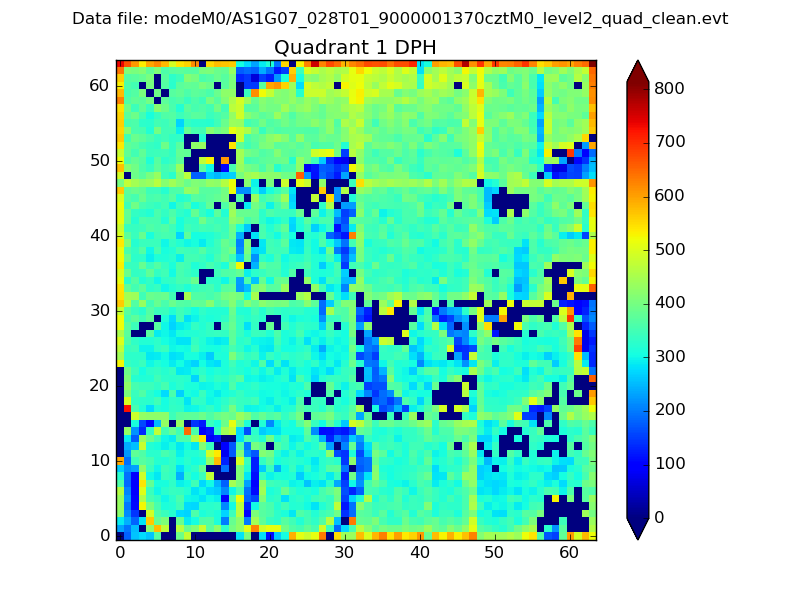
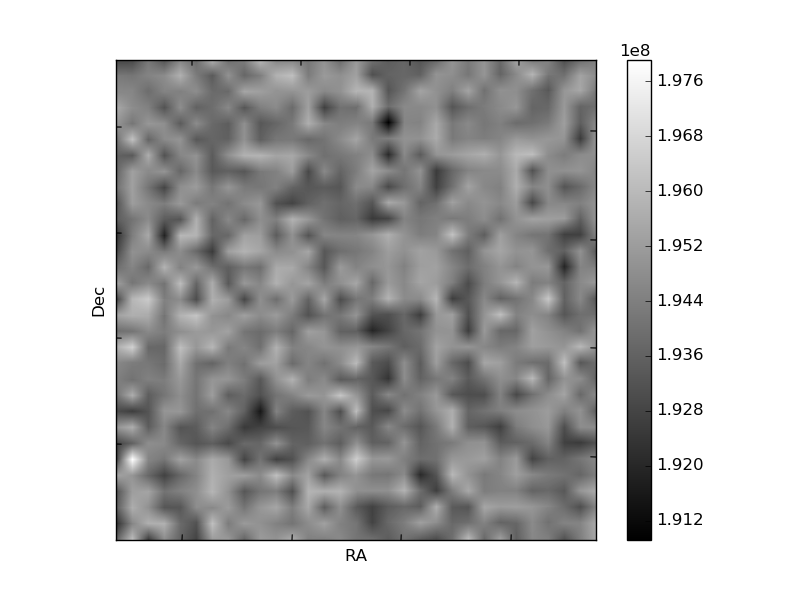
Histogram calculated using DETX and DETY for each event in the final _common_clean file
| Quadrant A |  |
 |
Quadrant B |
|---|---|---|---|
| Quadrant D |  |
 |
Quadrant C |
| Plot type | Count rate plots | Images |
|---|---|---|
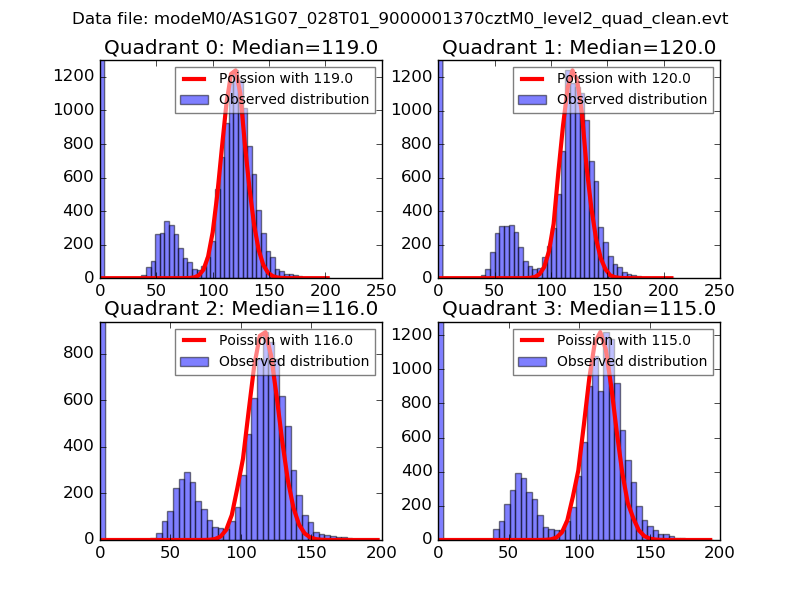
| Comparison with Poisson distribution Blue bars denote a histogram of data divided into 1 sec bins. Red curve is a Poisson curve with rate = median count rate of data. |
 |
 |
| Quadrant-wise count rates Data is divided into 100 sec bins |
 |
|
| Module-wise count rates for Quadrant A Data is divided into 100 sec bins |
 |
 |
| Module-wise count rates for Quadrant B Data is divided into 100 sec bins |
 |
 |
| Module-wise count rates for Quadrant C Data is divided into 100 sec bins |
 |
 |
| Module-wise count rates for Quadrant D Data is divided into 100 sec bins |
 |
 |
| Parameter | Plot |
|---|---|
| CZT HV Monitor |  |
| D_VDD |  |
| Temperature 1 |  |
| Veto HV Monitor |  |
| Veto LLD |  |
| Alpha Counter |  |
| _CPM_Rate | 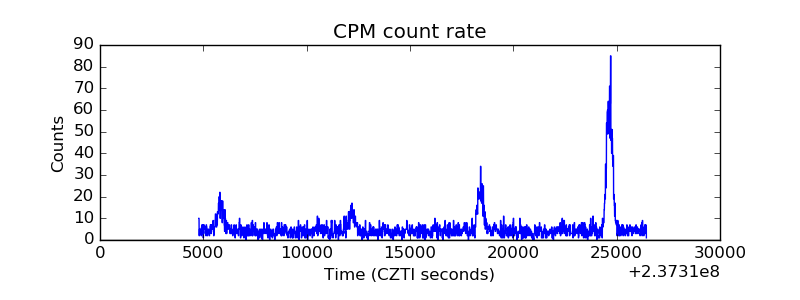 |
| CZT Counter |  |
| +2.5 Volts monitor |  |
| +5 Volts monitor | 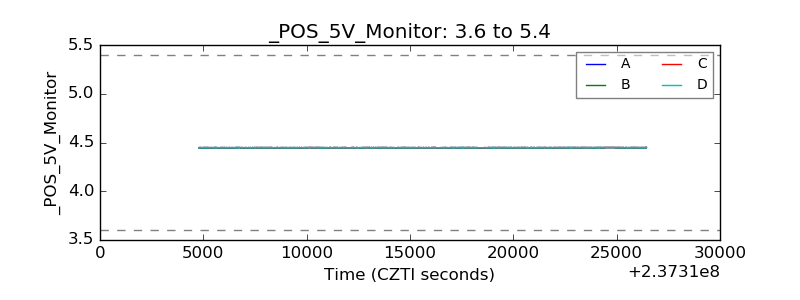 |
| _ROLL_ROT |  |
| _Roll_DEC | 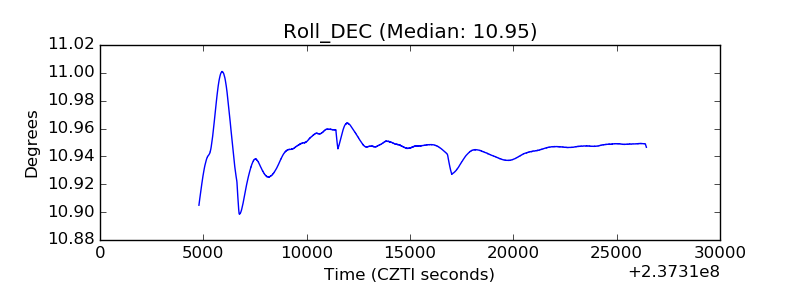 |
| _Roll_RA |  |
| Veto Counter |  |