| Param | Original file | Final file |
|---|---|---|
| Filename | modeM0/AS1A03_077T01_9000001372cztM0_level2_bc.evt | modeM0/AS1A03_077T01_9000001372cztM0_level2_quad_clean.evt |
| Size (bytes) | 4,031,893,440 | 1,479,009,600 |
| Size | 3.8 GB | 1.4 GB |
| Events in quadrant A | 23,894,605 | 9,330,265 |
| Events in quadrant B | 25,767,568 | 9,367,941 |
| Events in quadrant C | 23,379,133 | 9,290,050 |
| Events in quadrant D | 41,012,832 | 8,717,857 |
| Mode M9 | |||
|---|---|---|---|
| Quadrant | BADHDUFLAG | Total packets | Discarded packets |
| A | 0 | 208 | 0 |
| B | 0 | 208 | 0 |
| C | 0 | 209 | 0 |
| D | 0 | 213 | 0 |
| Mode SS | |||
|---|---|---|---|
| Quadrant | BADHDUFLAG | Total packets | Discarded packets |
| A | 0 | 2430 | 0 |
| B | 0 | 2415 | 0 |
| C | 0 | 2416 | 0 |
| D | 0 | 2419 | 0 |
| Mode M0 | |||
|---|---|---|---|
| Quadrant | BADHDUFLAG | Total packets | Discarded packets |
| A | 0 | 243251 | 0 |
| B | 0 | 248119 | 0 |
| C | 0 | 241820 | 0 |
| D | 0 | 295337 | 0 |
| Quadrant | Total seconds | Saturated seconds | Saturation percentage |
|---|---|---|---|
| A | 118237 | 1010 | 0.854217% |
| B | 118089 | 1175 | 0.995012% |
| C | 118209 | 721 | 0.609937% |
| D | 117148 | 3655 | 3.119985% |
Noise dominated data is calculated using 1-second bins in cleaned event files. If a bin has >2000 counts, and if more than 50% of those come from <1% of pixels, then it is considered to be noise-dominated and hence unusable.
| Quadrant | # 1 sec bins | Bins with >0 counts | Bins with >2000 counts | High rate bins dominated by noise | Noise dominated (total time) | Noise dominated (detector-on time) | Marked lightcurve |
|---|---|---|---|---|---|---|---|
| A | 160910 | 125458 | 6 | 6 | 0.00% | 0.00% | 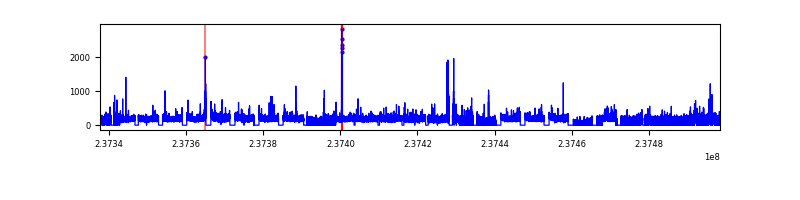 |
| B | 160908 | 125300 | 12 | 12 | 0.01% | 0.01% |  |
| C | 160910 | 125359 | 0 | 0 | 0.00% | 0.00% |  |
| D | 160910 | 124398 | 1073 | 1073 | 0.67% | 0.86% |  |
Top three noisy pixels from each quadrant. If the there are fewer than three noisy pixels in the level2.evt file, extra rows are filled as -1
| Pixel properties | Quadrant properties | ||||||
|---|---|---|---|---|---|---|---|
| Quadrant | DetID | PixID | Counts | Sigma | Mean | Median | Sigma |
| A | 15 | 174 | 199694 | 145.85 | 6052 | 5925 | 1328.6 |
| A | 7 | 223 | 114615 | 81.81 | 6052 | 5925 | 1328.6 |
| A | 14 | 111 | 91094 | 64.11 | 6052 | 5925 | 1328.6 |
| B | 0 | 214 | 955792 | 823.06 | 6097 | 5926 | 1154.1 |
| B | 0 | 219 | 412330 | 352.15 | 6097 | 5926 | 1154.1 |
| B | 0 | 229 | 319669 | 271.86 | 6097 | 5926 | 1154.1 |
| C | 14 | 234 | 56234 | 38.98 | 5933 | 5854 | 1292.5 |
| C | 14 | 67 | 36991 | 24.09 | 5933 | 5854 | 1292.5 |
| C | 13 | 61 | 36833 | 23.97 | 5933 | 5854 | 1292.5 |
| D | 1 | 52 | 6668024 | 4932.01 | 5806 | 5632 | 1350.8 |
| D | 8 | 195 | 5289049 | 3911.19 | 5806 | 5632 | 1350.8 |
| D | 7 | 71 | 2826395 | 2088.14 | 5806 | 5632 | 1350.8 |
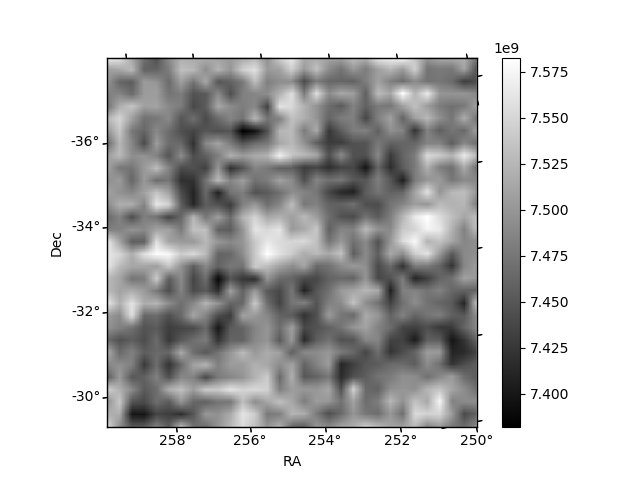
Histogram calculated using DETX and DETY for each event in the final _common_clean file
| Quadrant A |  |
 |
Quadrant B |
|---|---|---|---|
| Quadrant D |  |
 |
Quadrant C |
| Plot type | Count rate plots | Images |
|---|---|---|
| Comparison with Poisson distribution Blue bars denote a histogram of data divided into 1 sec bins. Red curve is a Poisson curve with rate = median count rate of data. |
 |
 |
| Quadrant-wise count rates Data is divided into 100 sec bins |
 |
|
| Module-wise count rates for Quadrant A Data is divided into 100 sec bins |
 |
 |
| Module-wise count rates for Quadrant B Data is divided into 100 sec bins |
 |
 |
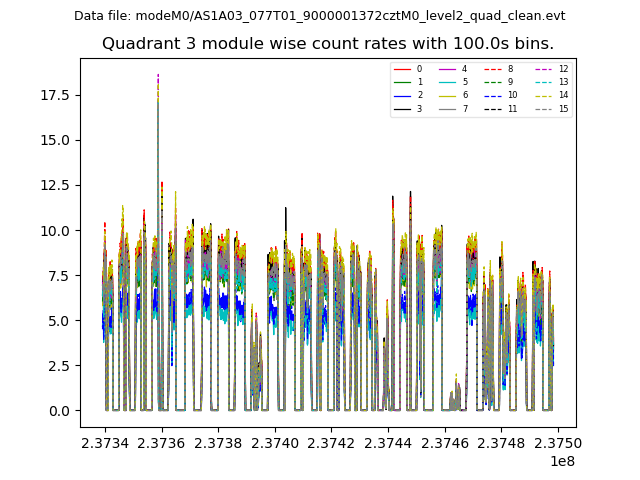
| Module-wise count rates for Quadrant C Data is divided into 100 sec bins |
 |
 |
| Module-wise count rates for Quadrant D Data is divided into 100 sec bins |
 |
 |
| Parameter | Plot |
|---|---|
| CZT HV Monitor |  |
| D_VDD |  |
| Temperature 1 |  |
| Veto HV Monitor |  |
| Veto LLD |  |
| Alpha Counter |  |
| _CPM_Rate | 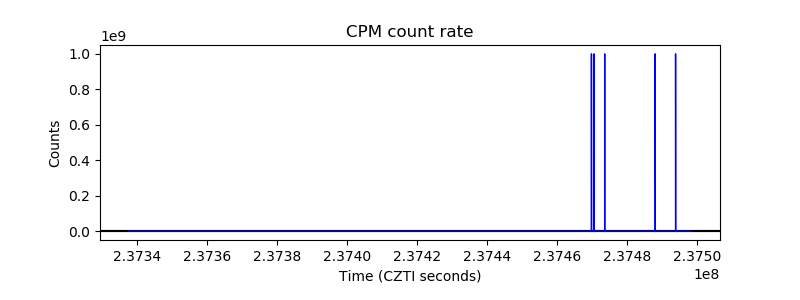 |
| CZT Counter |  |
| +2.5 Volts monitor | 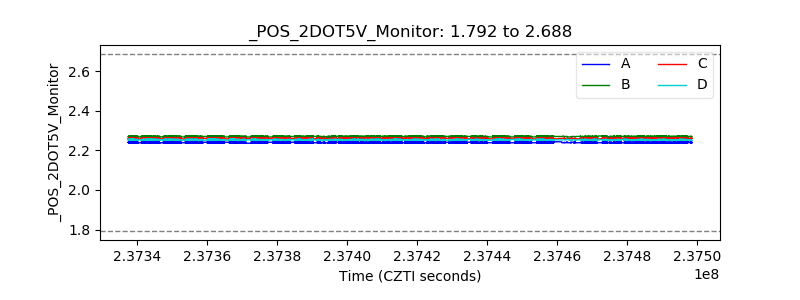 |
| +5 Volts monitor |  |
| _ROLL_ROT |  |
| _Roll_DEC |  |
| _Roll_RA |  |
| Veto Counter |  |